14Jan

Eicher Motors Share Price Analysis: Elliott Wave Forecast, Technical Insights, Price Action, Stock Trends, and Investment Strategy

EICHER MOTORS – EICHERMOT Elliott Wave Technical Analysis (1D Chart)

EICHERMOT Elliott Wave Analysis

Larger Degree Trend: Higher (Intermediate Degree, Orange)

  • Mode: Motive
  • Structure: Impulse
  • Position: Minute Wave ((v)) Navy

Analysis Details:

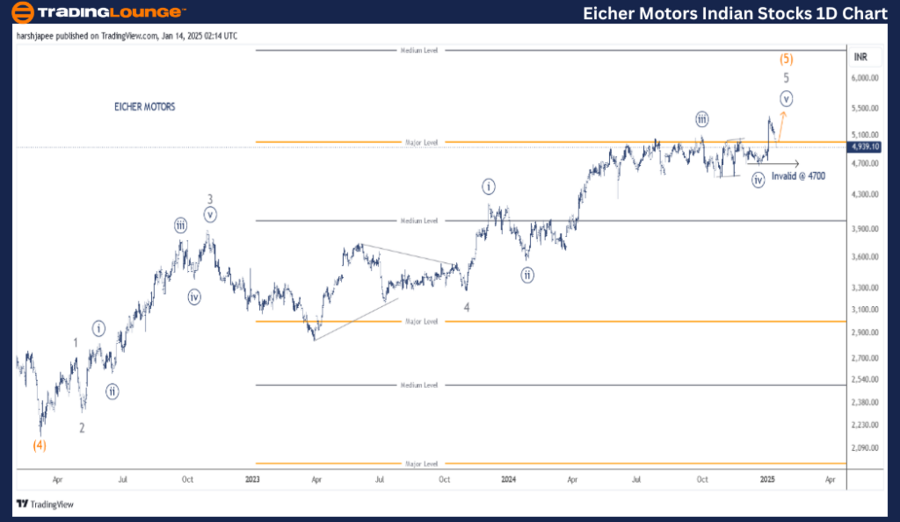
The wave counts have been revised following a price action breakout above the 5300 zone. The stock appears to be unfolding Minute Wave ((v)) of Minor Wave 5, which lies within Intermediate Wave (5) Orange.

  • Invalidation Point: 4700

EICHER MOTORS Daily Chart: Technical Analysis and Potential Elliott Wave Counts

The daily chart indicates a strong upward trend, progressing toward a potential termination above the 5400 mark. However, if the stock declines below 4800 and then 4700, it could signal that Wave 5 of (5) concluded near the 5390-5400 zone.

  • Intermediate Wave (4) ended around 2160 levels in March 2022.
  • The subsequent rally unfolded a five-wave progression toward the 5390 level.

At this stage, the stock may be approaching a significant peak or might have already reached it around 5400 levels.

EICHER-MOTORS-1d-ind...


EICHER MOTORS – EICHERMOT Elliott Wave Technical Analysis (4H Chart)

Larger Degree Trend: Higher (Intermediate Degree, Orange)

  • Mode: Motive
  • Structure: Impulse
  • Position: Minute Wave ((v)) Navy

Analysis Details:

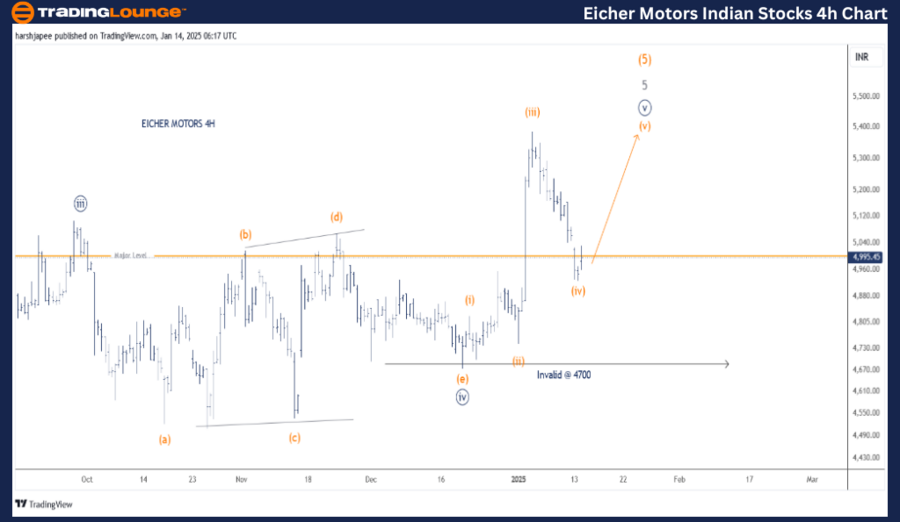
The wave counts were adjusted as the price crossed the 5300 zone, suggesting that the stock is forming Minute Wave ((v)) of Minor Wave 5 within Intermediate Wave (5) Orange. Minute Wave ((iv)) unfolded as a triangle, and Minute Wave ((v)) appears to be progressing as an impulse.

  • Invalidation Point: 4700

EICHER MOTORS 4H Chart: Technical Analysis and Potential Elliott Wave Counts

The 4H chart highlights sub-waves of Minor Wave 5 within Intermediate Wave (5):

  • Minute Wave ((iii)) terminated around 5100 levels.
  • Minute Wave ((iv)) unfolded as a potential triangle, likely terminating around 4700.

If this count holds, Minute Wave ((v)) could continue progressing upward, unfolding as an impulse. Prices should remain above the 4830-4840 zone to maintain the impulse structure. A drop below this level would confirm that the stock has already reached a peak near the 5390-5400 zone.

Technical Analyst: Harsh Japee

Source: visit Tradinglounge.com and learn From the Experts Join TradingLounge Here 

Previous:  ADANI PORTS and SEZ – ADANIPORTS Elliott Wave Technical Analysis

VALUE Offer - Buy 1 Month & Get 3 Months!Click here

Access 7 Analysts Over 200 Markets Covered. Chat Room With Support

EICHER-MOTORS-4h-ind...


Conclusion:

EICHER MOTORS is advancing within Minute Wave ((v)) of Minor Wave 5 of Intermediate Wave (5), with 4700 as the key invalidation point for this wave count.

Related

Natural Gas Commodity Elliottwave Technical Analysis: Focusing on the Current Bearish Trend

Natural Gas Commodity Elliottwave Technical Analysis: Focusing on the Current Bearish Trend

Elliott Wave Analysis of Natural Gas, focusing on the current bearish trend and its implications for...

Read More >
Looking to Buy the Best NASDAQ Stocks or Explore NDX ETFs With NASDAQ Index Elliott Wave Technical Analysis

Looking to Buy the Best NASDAQ Stocks or Explore NDX ETFs With NASDAQ Index Elliott Wave Technical Analysis

Gain valuable insights into NASDAQ Composite trading with our Elliott Wave analysis. Discover expert...

Read More >
Crisp Stock Market Analysis and Winning Trading Strategies for AAPL, TSLA, AMZN, NVDA, MSFT, and More

Crisp Stock Market Analysis and Winning Trading Strategies for AAPL, TSLA, AMZN, NVDA, MSFT, and More

comprehensive stock market analysis and trading strategy overview for various prominent stocks, incl...

Read More >
Unlocking ASX Trading Success: RMD - RESMED INC Stock Analysis & Elliott Wave Technical Forecast

Unlocking ASX Trading Success: RMD - RESMED INC Stock Analysis & Elliott Wave Technical Forecast

Dive into our comprehensive Elliott Wave analysis of ResMed Inc (RMD) on the Australian Stock Exchan...

Read More >
NEO Crypto Price Elliott Wave Technical Analysis: Covers NEO Price Trends, Re-entry Points, and The Role of Bearish Momentum

NEO Crypto Price Elliott Wave Technical Analysis: Covers NEO Price Trends, Re-entry Points, and The Role of Bearish Momentum

Explore the latest NEOUSD Elliott Wave analysis focusing on the transition from wave 2 to wave 3, wi...

Read More >
SP500, NASDAQ 100, DAX 40, FTSE 100, ASX 200: Elliott Wave Trading Strategies

SP500, NASDAQ 100, DAX 40, FTSE 100, ASX 200: Elliott Wave Trading Strategies

TradingLounge’s Elliott Wave Analysis blog post provides expert insights on major indices (S&P 500,...

Read More >

Buy 1 Month

Get 3 Months!

Special Offer:

Trade Recommendations

Unleash the power of deversified trading with our comprehensive portfolio, covering:

  • Stock Trades
  • Crypto Trades
  • Forex Trades
  • Commodity Trades
Elliott Wave Analysis

Gain a competive edge with expert insights in to:

  • Global Indices
  • US Stocks & ASX Stocks
  • Forex & Crypto
  • Commodities
Top-Notch Trading Tools

Equip yourself with the tools of success:

  • Social Chat
  • Elliott Wave Algorithm
  • Screener
  • TradingLevels
  • Trading Game
7 Elliott Wave Analysts

Stay ahead of the market with daily charts and insightful videos
-Your secret to strategic trading!

JOIN HERE


Welcome to TradingLounge (ASIC A.R.No. 321187), specialists in trades, trading education and technical analysis, covering stocks, indices, commodities, forex and cryptocurrencies.

When you join TradingLounge you have access to everything we offer, including trade tools, educational content and a social platform to chat with like-minded investors.

Read more

@Copyright 2024 by tradinglounge.com

Contact Us

Australian no: 02 4787 6020

International no: +61 (2) 47876020

Pay with:

Find us on