13Jan

ADANI PORTS and SEZ Indian Stocks Elliott Wave Technical Analysis: Share Price Insights, Market Trends, and Forecasts

ADANI PORTS and SEZ – ADANIPORTS (1D Chart) Elliott Wave Technical Analysis

ADANIPORTS Elliott Wave Analysis

Function: Counter Trend (Minor degree, Grey)

Mode: Corrective

Structure: Impulse within larger degree correction

Position: Minute Wave ((iii)) Navy

Details:

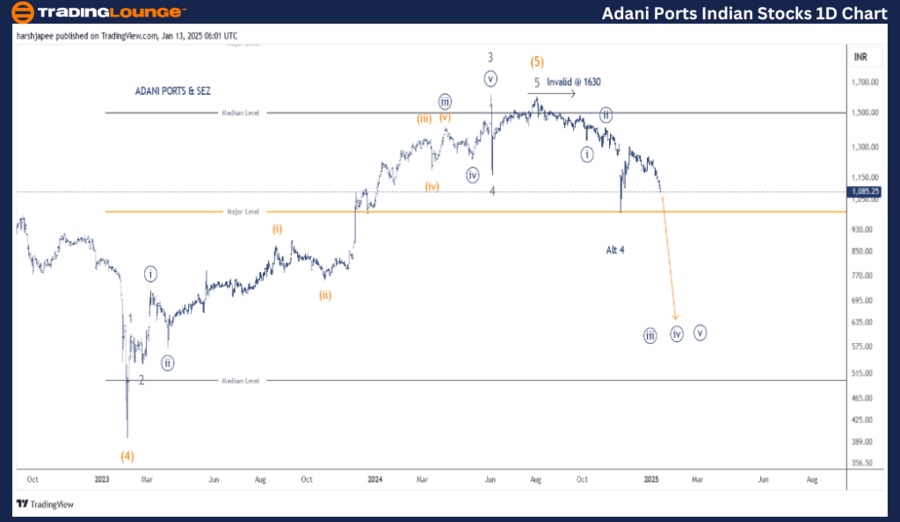
  • Minute Wave ((iii)) is progressing lower against the 1630 resistance level.
  • Alternatively, Minor Wave 4 appears complete near the 1000 mark, indicating the potential for a higher push.
  • Invalidation Point: 1630

ADANI PORTS & SEZ Daily Chart Technical Analysis and Potential Elliott Wave Counts

ADANI PORTS & SEZ daily chart highlights a potential trend reversal below the 1630 high, marking the end of Intermediate Wave (5) Orange. The stock is progressing through Minute Wave ((iii)), with the possibility of targeting levels well below the 1000 mark.

  • Intermediate Wave (4) Orange concluded near 395 in February 2023.
  • The subsequent rally subdivided into five waves, with Wave 5 ending as a truncation near 1610.
  • Minor Wave 3 extended to 1620 in June 2024, followed by a sharp correction in Minor Wave 4 around 1165.
  • Minor Wave 5 truncated near 1610, after which the stock turned bearish.

For bearish momentum to remain dominant, prices should stay below the 1610-1630 range.

ADANIPORTS-1d-stock-...


ADANI PORTS and SEZ – ADANIPORTS (4H Chart) Elliott Wave Technical Analysis

Function: Counter Trend (Minor degree, Grey)

Mode: Corrective

Structure: Impulse within larger degree correction

Position: Minute Wave ((iii)) Navy

Details:

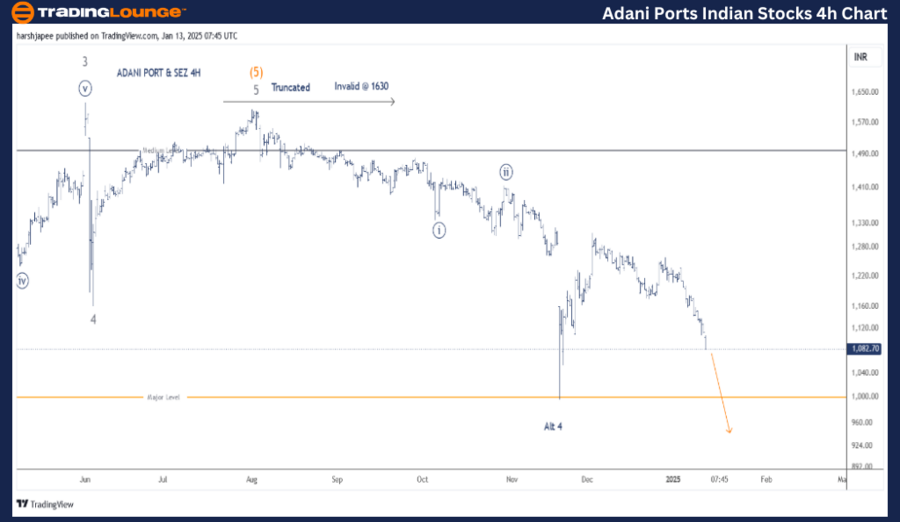
  • Minute Wave ((iii)) is progressing against the 1630 level.
  • Alternatively, Minor Wave 4 seems complete near the 1000 level, hinting at the potential for an upward move.
  • Invalidation Point: 1630

ADANI PORTS & SEZ 4H Chart Technical Analysis and Potential Elliott Wave Counts

The 4H chart for ADANI PORTS & SEZ reflects the sub-waves after the Minor Wave 4 Grey correction, which ended near 1165 in June 2024. Minor Wave 5 ended as a truncation close to the 1610 mark, leading to a subsequent decline.

  • Minute Wave ((i)) terminated near 1340, followed by an expanded flat Wave ((ii)) around 1420.
  • The stock is currently in an extended Minute Wave ((iii)), which is showing signs of unfolding lower.
  • A decisive break below the 1000 level would confirm the bearish extension and accelerate the downward move.

Technical Analyst: Harsh Japee

Source: visit Tradinglounge.com and learn From the Experts Join TradingLounge Here 

Previous: BHARAT Electronics Ltd. (BEL) Elliott Wave Technical Analysis

VALUE Offer - Buy 1 Month & Get 3 Months!Click here

Access 7 Analysts Over 200 Markets Covered. Chat Room With Support

ADANIPORTS-4h-stock-...


Conclusion

ADANI PORTS & SEZ appears to be carving out Minute Wave ((iii)) of a corrective structure within a larger trend. Prices are trending lower with strong resistance in the 1610-1630 range. A significant move below the 1000 mark would reinforce bearish sentiment.

Related

Expert Elliott Wave Analysis on Global Indices: S&P 500, NASDAQ 100, DAX 40, FTSE 100 & ASX 20

Expert Elliott Wave Analysis on Global Indices: S&P 500, NASDAQ 100, DAX 40, FTSE 100 & ASX 20

Gain comprehensive insights with our expert Elliott Wave analysis covering major global indices. Sta...

Read More >
The Home Depot (HD) Stocks Elliott Wave Technical Analysis: Focusing on its Bullish Momentum and Key Levels at $500 Target

The Home Depot (HD) Stocks Elliott Wave Technical Analysis: Focusing on its Bullish Momentum and Key Levels at $500 Target

This article provides an Elliott Wave analysis of The Home Depot (HD) stock, focusing on its bullish...

Read More >
Asx Stock's Potential Movement Stay Updated with our NWS Stock Analysis & Elliott Wave Technical Forecast

Asx Stock's Potential Movement Stay Updated with our NWS Stock Analysis & Elliott Wave Technical Forecast

Our detailed Elliott Wave analysis on ASX: News Corporation (NWS) provides a comprehensive outlook o...

Read More >
Mastering Bitcoin/ U.S. dollar(BTCUSD) Elliott Wave Technical Analysis for Profitable Trading

Mastering Bitcoin/ U.S. dollar(BTCUSD) Elliott Wave Technical Analysis for Profitable Trading

As of February 29, 2024, leverage the insights from TradingLounge's daily and 4-hour BTCUSD char...

Read More >
XRP Elliott Wave Analysis: XRPUSD Price Forecast, Ripple Trading Strategy, Daily and H4 Chart Update for Crypto Traders

XRP Elliott Wave Analysis: XRPUSD Price Forecast, Ripple Trading Strategy, Daily and H4 Chart Update for Crypto Traders

Get the latest XRP Elliott Wave analysis for daily and H4 charts, covering XRP price prediction, tra...

Read More >

Buy 1 Month

Get 3 Months!

Special Offer:

Trade Recommendations

Unleash the power of deversified trading with our comprehensive portfolio, covering:

  • Stock Trades
  • Crypto Trades
  • Forex Trades
  • Commodity Trades
Elliott Wave Analysis

Gain a competive edge with expert insights in to:

  • Global Indices
  • US Stocks & ASX Stocks
  • Forex & Crypto
  • Commodities
Top-Notch Trading Tools

Equip yourself with the tools of success:

  • Social Chat
  • Elliott Wave Algorithm
  • Screener
  • TradingLevels
  • Trading Game
7 Elliott Wave Analysts

Stay ahead of the market with daily charts and insightful videos
-Your secret to strategic trading!

JOIN HERE


Welcome to TradingLounge (ASIC A.R.No. 321187), specialists in trades, trading education and technical analysis, covering stocks, indices, commodities, forex and cryptocurrencies.

When you join TradingLounge you have access to everything we offer, including trade tools, educational content and a social platform to chat with like-minded investors.

Read more

@Copyright 2024 by tradinglounge.com

Contact Us

Australian no: 02 4787 6020

International no: +61 (2) 47876020

Pay with:

Find us on