Corn Elliott Wave Analysis

Corn May Resume Bearish Trend Below 504.5
Corn is likely to continue its bearish trajectory from the April 2022 peak, following a corrective rebound from the August 2024 low. As long as the price remains under the critical resistance level of 504.5, the downward bias is expected to dominate in the short term.

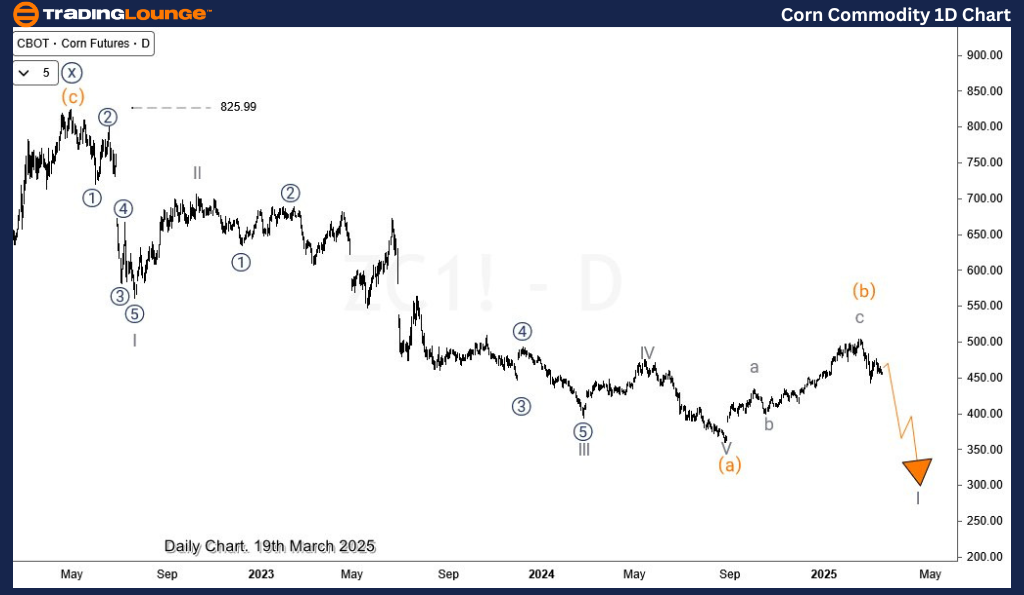
Corn Daily Chart Analysis

On the daily chart, Corn has been in a persistent downtrend since reaching a high of $826 in April 2022, plunging to $359 in August 2024. This decline followed a five-wave bearish impulse, which we can identify as wave (a) of the supercycle degree.

A corrective wave (b) then retraced part of the losses, pushing prices toward $504. If this correction has concluded, Corn is now set to begin wave (c) of the supercycle degree, which could drive prices down toward $220 in the coming months.

However, an alternate scenario remains where wave (b) could extend further in a double correction before the bearish momentum resumes.

Corn-Commodity-1D-Ch...


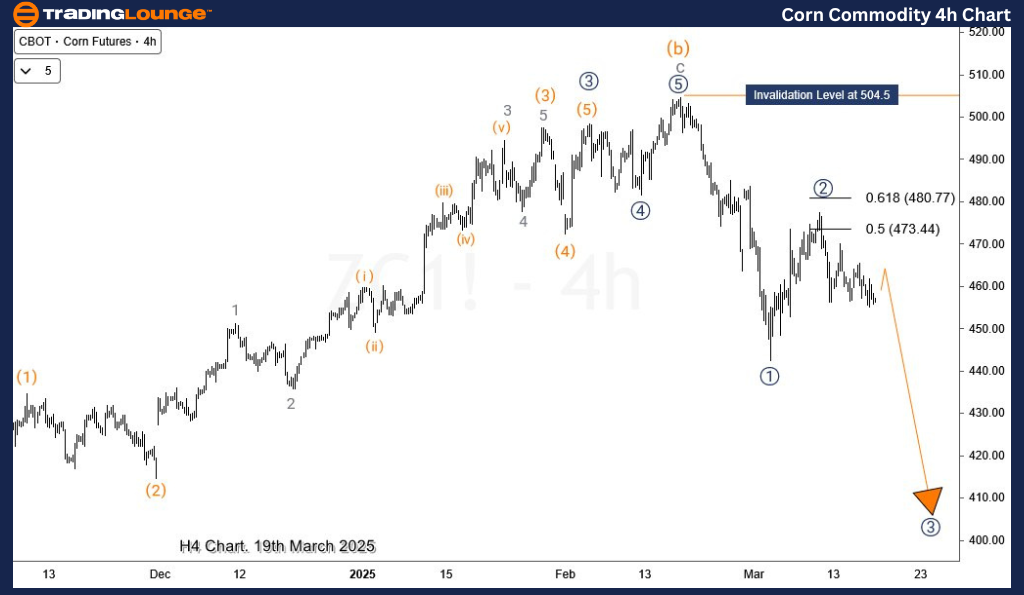
Corn H4 Chart Analysis

On the H4 timeframe, the internal structure of wave I of (c) is forming. The first bearish leg, labeled wave ((1)), concluded on March 4, 2025. A subsequent corrective rally as wave ((2)) has reached the key Fibonacci retracement zone.

As long as wave ((1))'s low holds, there is still potential for wave ((2)) to extend higher toward $477 before the downtrend resumes. If Corn breaks below wave ((1))'s low, further downside movement is expected, targeting the 417-394 zone in the short term.

This analysis follows the Elliott Wave framework, highlighting potential price movements based on wave structures. Keep an eye on key resistance at 504.5 and Fibonacci retracement levels to confirm the next market direction.

Technical Analyst: Sanmi Adeagbo

Source: Visit Tradinglounge.com and learn from the Experts Join TradingLounge Here 

See Previous: Coffee Elliott Wave Technical Analysis

VALUE Offer - Buy 1 Month & Get 3 Months!Click here

Access 7 Analysts Over 200 Markets Covered. Chat Room With Support

Corn-Commodity-4h-Ch...

Related

Bitcoin (BTCUSD) Elliott Wave Technical Analysis: Price Forecast Targets $123,183 as Wave 3 Momentum Builds

Bitcoin (BTCUSD) Elliott Wave Technical Analysis: Price Forecast Targets $123,183 as Wave 3 Momentum Builds

Elliott Wave technical analysis for BTC/USD, highlighting Bitcoin's current position in Wave 3 w...

Read More >
Elliott Wave Forecast for PayPal (PYPL) US Stock: Bullish Wave C Movement Across Daily and Hourly Charts Explained in Detail

Elliott Wave Forecast for PayPal (PYPL) US Stock: Bullish Wave C Movement Across Daily and Hourly Charts Explained in Detail

This Elliott Wave breakdown for PayPal (PYPL) highlights a bullish trend in Wave C across daily and ...

Read More >
British Pound/Japanese Yen(GBPJPY) Elliottwave Technical analysis - A Comprehensive Overview for Day and 4-Hour Charts

British Pound/Japanese Yen(GBPJPY) Elliottwave Technical analysis - A Comprehensive Overview for Day and 4-Hour Charts

This comprehensive guide offers an in-depth Elliott Wave analysis of the GBPJPY currency pair, provi...

Read More >
Spotify Technology S.A. (SPOT) Stocks Elliott Wave Technical Analysis includes Trading Strategy and Market Trends

Spotify Technology S.A. (SPOT) Stocks Elliott Wave Technical Analysis includes Trading Strategy and Market Trends

This article provides an in-depth Elliott Wave analysis of Spotify Technology S.A. (SPOT), covering ...

Read More >
WTI Crudeoil Commodity Elliott Wave Technical Analysis: Price Prediction and Market Trends Shaping Crude Oil Trading

WTI Crudeoil Commodity Elliott Wave Technical Analysis: Price Prediction and Market Trends Shaping Crude Oil Trading

Stay informed with our WTI crude oil Elliott Wave analysis and technical price forecast. Understand ...

Read More >
U.S.Dollar /Canadian Dollar(USD/CAD) Elliott Wave Technical Analysis 29 November 23

U.S.Dollar /Canadian Dollar(USD/CAD) Elliott Wave Technical Analysis 29 November 23

USD and CAD Elliott Wave Analysis Trading Lounge Day Chart dated 29 November 23, delves into a detai...

Read More >

$1 for 2 Weeks

then $29 a month!

What a Special Offer!

Trade Recommendations

Unleash the power of deversified trading with our comprehensive portfolio, covering 250+ markets:

  • Stock Trades
  • Crypto Trades
  • Forex Trades
  • Commodity Trades
Elliott Wave Analysis

Gain a competitive edge with expert insights and AI-powered Elliott Wave charting into:

  • Global Indices
  • US Stocks & ASX Stocks
  • Forex & Crypto
  • Commodities
Top-Notch Trading Tools

Equip yourself with the tools of success:

  • Real-time Chat rooms
  • Elliott Wave Algorithm
  • Portfolio tools
  • TradingLevels
  • Screener
  • Trading Game
7 Elliott Wave Analysts

Stay ahead of the market with daily charts and insightful videos
Your secret to strategic trading!

JOIN HERE


Welcome to TradingLounge (ASIC A.R.No. 321187), specialists in trades, trading education and technical analysis, covering stocks, indices, commodities, forex and cryptocurrencies.

When you join TradingLounge you have access to everything we offer, including trade tools, educational content and a social platform to chat with like-minded investors.

Read more

@Copyright 2024 by tradinglounge.com

Contact Us

Australian no: 02 4787 6020

International no: +61 (2) 47876020

Pay with:

Find us on