Coffee Elliott Wave Analysis
Coffee Prices Poised for a Potential Rebound After Correction
Coffee prices continue their corrective decline from the February peak, falling below the crucial $366 support level. This retracement is unfolding as wave ((4)) of III and could extend toward the $355.13 - $330.79 zone, a key area where fresh buying interest may emerge, potentially resuming the broader bullish trend that started from the October 2023 low.
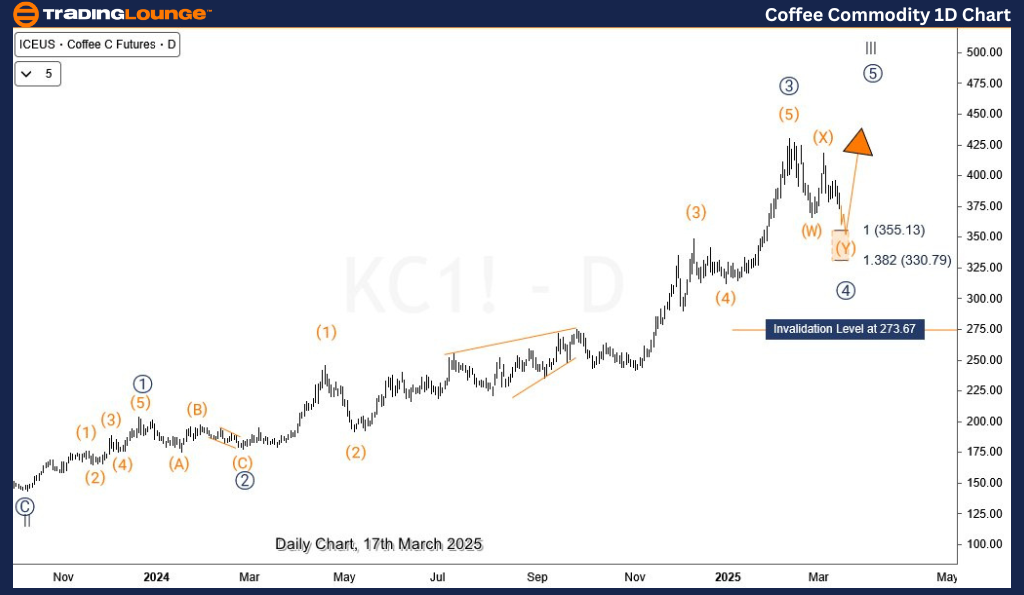
Coffee Daily Chart Analysis
The daily chart structure indicates that wave ((II)) concluded in January 2023, followed by the development of wave I and II of (III). The subsequent rally in wave III, which began in October 2023, has shown strong momentum, with the current pullback forming a double zigzag correction in wave ((4)).
Once this corrective phase completes, wave ((5)) of III is expected to drive prices higher, leading to the final leg of the impulse sequence before a more significant wave IV correction takes place.
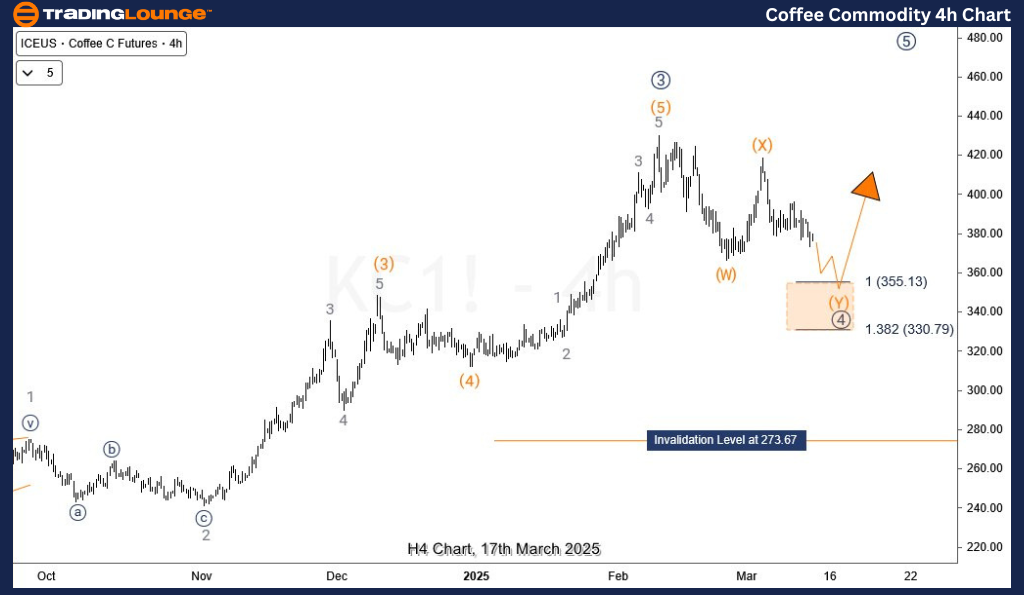
Coffee H4 Chart Analysis
A closer look at the H4 timeframe reveals that the ongoing correction is progressing within the sub-wave structure of wave ((4)). The decline is currently unfolding in wave (Y) of the double zigzag pattern, which could push prices lower into the $355.13 - $330.79 price zone—a potential completion area for wave ((4)).
If prices stabilize within this key support zone, it could present a fresh buying opportunity, setting the stage for the final wave ((5)) of III. Traders should monitor this level closely, as a bullish reversal from this area could signal the beginning of the next impulsive move higher.
Technical Analyst: Sanmi Adeagbo
Source: Visit Tradinglounge.com and learn from the Experts Join TradingLounge Here
See Previous: SGX TSI Iron Ore Elliott Wave Technical Analysis
VALUE Offer - Buy 1 Month & Get 3 Months!Click here
Access 7 Analysts Over 200 Markets Covered. Chat Room With Support