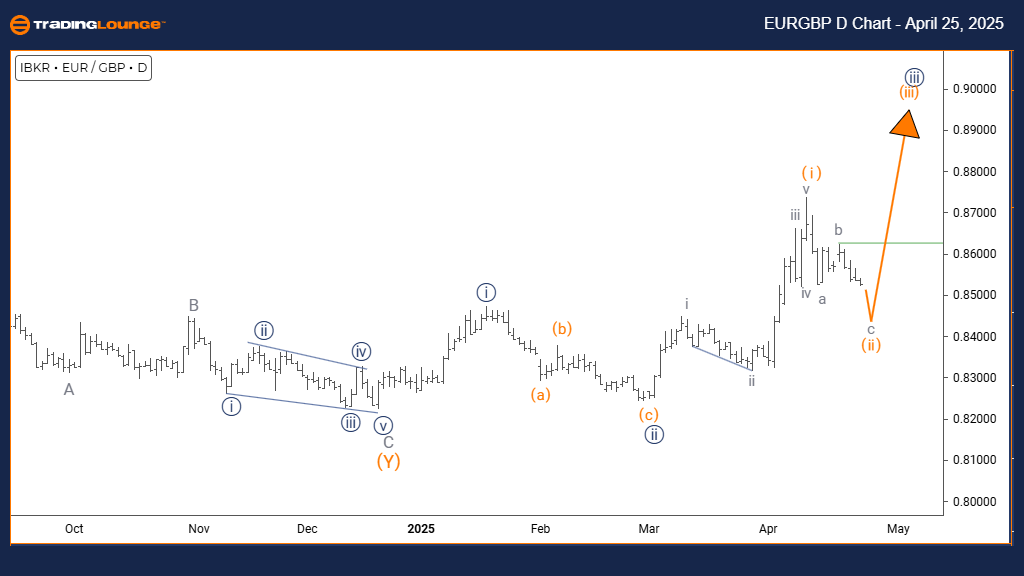
Euro/British Pound (EURGBP) Daily Chart Elliott Wave Analysis - TradingLounge
EURGBP Elliott Wave Technical Analysis
FUNCTION: Counter Trend
MODE: Corrective
STRUCTURE: Orange Wave 2
POSITION: Navy Blue Wave 3
DIRECTION NEXT HIGHER DEGREES: Orange Wave 3
DETAILS: Orange wave 1 looks completed, with orange wave 2 now developing.
The EURGBP daily Elliott Wave analysis highlights a corrective rally against the prevailing bearish trend. After completing the orange wave 1 decline, EURGBP has entered orange wave 2—a corrective phase within the broader navy blue wave 3 downtrend. This structure suggests a temporary upside retracement before the main bearish trend resumes.
Orange wave 2 is expected to retrace between 38% and 61% of orange wave 1's decline. Corrective phases like this typically feature overlapping price action and weaker momentum, aligning with classic Elliott Wave patterns. The EURGBP daily chart context signals a short-term pause in a larger bearish cycle.
Once wave 2 finalizes, a strong downward move—orange wave 3—is anticipated. This bearish impulse could extend below the prior low formed by wave 1. Traders should closely monitor for signs of wave 2 completion, including bearish reversal candlestick patterns and overbought technical indicators.
This corrective wave offers a potential setup for traders targeting the next bearish move in orange wave 3. Applying Elliott Wave tools and Fibonacci retracement zones will help confirm the end of wave 2 and optimize trade entries. Overall, the daily Elliott Wave count suggests EURGBP will likely continue its downward trend after this correction phase.
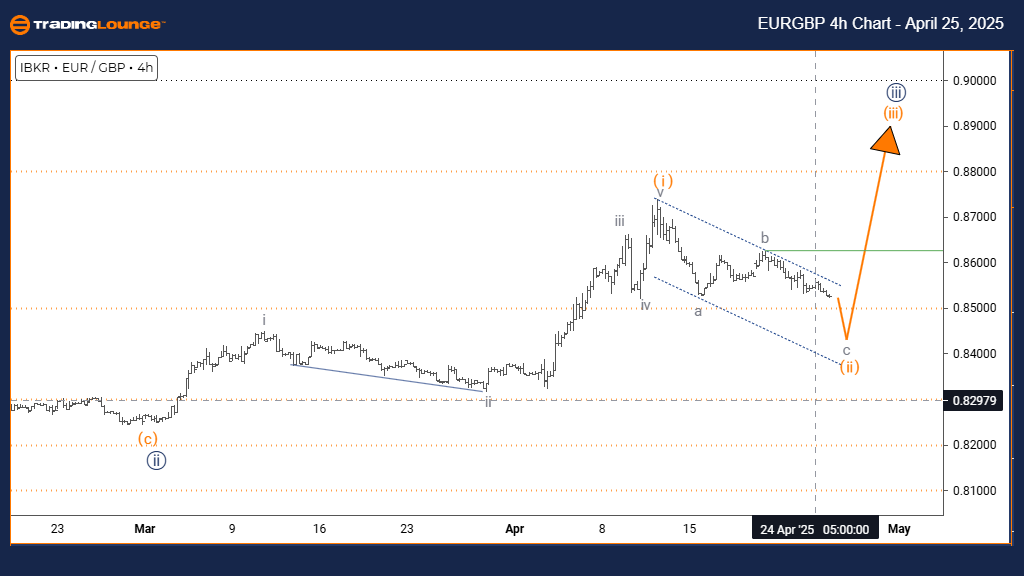
Euro/British Pound (EURGBP) 4h Chart Elliott Wave Analysis - TradingLounge
EURGBP Elliott Wave Technical Analysis
FUNCTION: Counter Trend
MODE: Impulsive as C
STRUCTURE: Gray Wave C
POSITION: Orange Wave 2
DIRECTION NEXT HIGHER DEGREES: Orange Wave 3
DETAILS: Gray wave B of wave 2 appears complete, with gray wave C now advancing.
The EURGBP 4-hour Elliott Wave analysis shows a counter-trend development with an impulsive structure unfolding. After completing gray wave B, the market is progressing upward through gray wave C within the larger corrective structure of orange wave 2. This setup indicates a temporary bullish movement before the broader downtrend resumes.
Gray wave C often acts as the final push in a corrective structure, typically displaying strong momentum. As gray wave B has finished, gray wave C is actively unfolding higher, and further gains are expected before the overall correction concludes. The 4-hour chart highlights a continuation of this counter-trend rally within the larger bearish outlook.
Following the completion of gray wave C, the next major movement is expected to be orange wave 3—a powerful bearish impulse that would resume the dominant downtrend. This outlook aligns with the larger daily chart analysis, framing the current 4-hour move as a short-term correction within a longer-term decline.
Traders should track gray wave C’s behavior for typical impulsive characteristics, including strong directional price action. Monitoring technical indicators will also help in spotting early signs of wave C's completion.
This structure provides traders an opportunity to position ahead of a potential trend reversal. Careful observation of price patterns during gray wave C will be crucial for identifying the beginning of the next major bearish wave.
Technical Analyst: Malik Awais
Source: Visit Tradinglounge.com and learn from the Experts. Join TradingLounge Here
Previous: USDCAD Elliott Wave Technical Analysis
VALUE Offer - Buy 1 Month & Get 3 Months!Click here
Access 7 Analysts Over 200 Markets Covered. Chat Room With Support