07May

Newmont Corporation ASX: NEM Elliott Wave Analysis Reveals Bullish Price Targets and Trading Signals for Gold Stock Investors

ASX: NEWMONT CORPORATION - NEM Elliott Wave Technical Analysis | TradingLounge

Greetings,

Today's Elliott Wave technical analysis focuses on Newmont Corporation (ASX: NEM) listed on the Australian Stock Exchange.
Our updated analysis suggests that ASX:NEM is currently progressing through a third wave advance.
This report outlines key target levels and invalidation points, providing traders with clear benchmarks for confirming the bullish trend or recognizing potential risks.


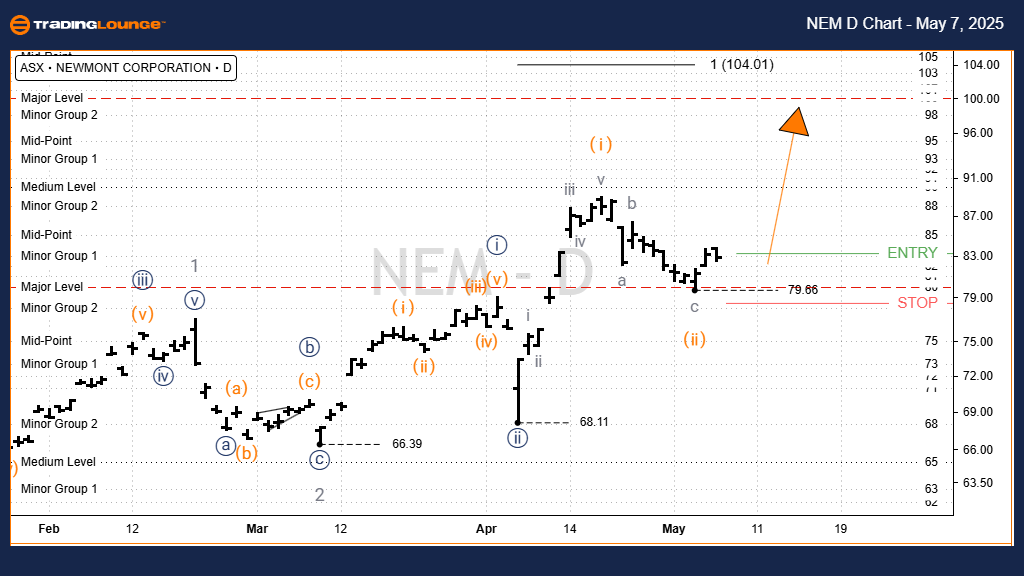
ASX: NEWMONT CORPORATION - NEM Elliott Wave Technical Analysis | 1D Chart (Semilog Scale)

Function: Major trend (Intermediate degree, orange)

Mode: Motive

Structure: Impulse

Position: Wave 3 - grey within Wave (3) - orange

Details:

  • Wave 2 (orange) completed near the 58.92 low.
  • Wave 3 (orange) has initiated a strong upward movement.
  • This wave is subdividing internally: wave 1 - grey, wave 2 - grey, and now wave 3 - grey pushing higher towards 102.37.
  • The primary target for wave 3 - grey is around the 100.00 level.

Invalidation Point: 79.66

NEWMONT-d-asx-chart-...


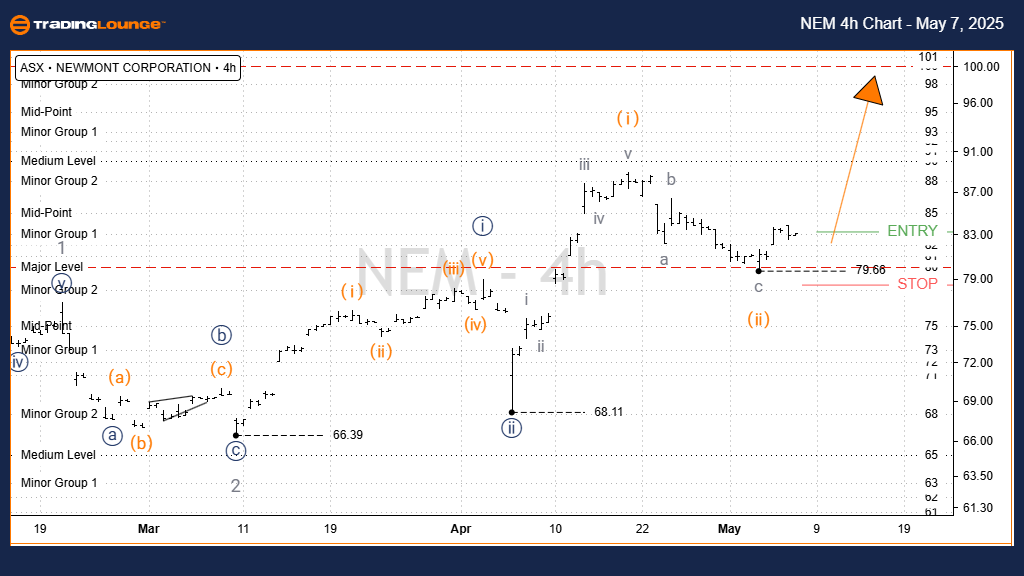
ASX: NEWMONT CORPORATION - NEM 4-Hour Chart Analysis

Function: Major trend (Minor degree, grey)

Mode: Motive

Structure: Impulse

Position: Wave iii) - orange within Wave ((iii)) - navy of Wave 3 - grey

Details:

  • From the 58.92 low, wave 3 (orange) has developed with strong upward momentum.
  • Currently, wave iii) (navy) is unfolding, with a projected target around 100.00.
  • Maintaining a price above 79.66 is critical to support the bullish Elliott Wave count.
  • In the near-term view, wave iii) (orange) is actively advancing from the 79.66 base towards the 100.00 mark.

Invalidation Point: 79.66

Technical Analyst: Hua (Shane) Cuong, CEWA-M (Master’s Designation).

Source: Visit Tradinglounge.com and learn from the Experts. Join TradingLounge Here 

See Previous: CAR GROUP LIMITED – CAR Elliott Wave Technical Analysis

VALUE Offer - Buy 1 Month & Get 3 Months!Click here

Access 7 Analysts Over 200 Markets Covered. Chat Room With Support

NEWMONT-4h-asx-chart...


Conclusion

Our technical outlook for ASX: NEWMONT CORPORATION - NEM provides actionable guidance for traders monitoring Elliott Wave structures.
By emphasizing specific validation and invalidation levels, we enhance confidence in the Elliott Wave forecast.
Incorporating these key technical indicators, we offer a comprehensive and professional analysis of market movements.

Related

Commodities: Rising Trends in USD DXY, 10-Year Yields, and Future Upside for Bitcoin, Gold and Silver

Commodities: Rising Trends in USD DXY, 10-Year Yields, and Future Upside for Bitcoin, Gold and Silver

The latest commodity market analysis, employing Elliott Wave Theory, indicates a nearing completion ...

Read More >
U.S. Dollar / Swiss Franc (USDCHF) Elliott Wave Forecast: Daily and 4-Hour Chart Analysis with Trading Strategies

U.S. Dollar / Swiss Franc (USDCHF) Elliott Wave Forecast: Daily and 4-Hour Chart Analysis with Trading Strategies

USDCHF Elliott Wave analysis across daily and 4-hour charts, providing forecasts, trading strategies...

Read More >
NIKKEI 225 Index Elliott Wave Technical Analysis: Understanding the Current Corrective Phase and Future Projections

NIKKEI 225 Index Elliott Wave Technical Analysis: Understanding the Current Corrective Phase and Future Projections

This article provides a detailed Elliott Wave analysis of the NIKKEI 225, examining the current corr...

Read More >
Learn about BTC price movements, trading strategies, and technical indicators: Bitcoin (BTCUSD) Elliott Wave analysis

Learn about BTC price movements, trading strategies, and technical indicators: Bitcoin (BTCUSD) Elliott Wave analysis

Get an in-depth Elliott Wave analysis of Bitcoin (BTCUSD) on both daily and 4-hour charts. Learn abo...

Read More >
TASI Index Elliott Wave Technical Analysis: Daily and Weekly Charts, Offering Insights and Strategies for the Saudi Stock Market

TASI Index Elliott Wave Technical Analysis: Daily and Weekly Charts, Offering Insights and Strategies for the Saudi Stock Market

The TASI Index is showing strong bullish momentum according to Elliott Wave analysis. Key highlights...

Read More >
Cardano Crypto Price News Today: Our Detailed Elliott Wave Technical Analysis ADAUSD Provides Detailed Insights

Cardano Crypto Price News Today: Our Detailed Elliott Wave Technical Analysis ADAUSD Provides Detailed Insights

Our detailed Elliott Wave Analysis for Cardano (ADAUSD) provides comprehensive insights into price p...

Read More >

$1 for 2 Weeks

then $29 a month!

What a Special Offer!

Trade Recommendations

Unleash the power of deversified trading with our comprehensive portfolio, covering 250+ markets:

  • Stock Trades
  • Crypto Trades
  • Forex Trades
  • Commodity Trades
Elliott Wave Analysis

Gain a competitive edge with expert insights and AI-powered Elliott Wave charting into:

  • Global Indices
  • US Stocks & ASX Stocks
  • Forex & Crypto
  • Commodities
Top-Notch Trading Tools

Equip yourself with the tools of success:

  • Real-time Chat rooms
  • Elliott Wave Algorithm
  • Portfolio tools
  • TradingLevels
  • Screener
  • Trading Game
7 Elliott Wave Analysts

Stay ahead of the market with daily charts and insightful videos
Your secret to strategic trading!

JOIN HERE


Welcome to TradingLounge (ASIC A.R.No. 321187), specialists in trades, trading education and technical analysis, covering stocks, indices, commodities, forex and cryptocurrencies.

When you join TradingLounge you have access to everything we offer, including trade tools, educational content and a social platform to chat with like-minded investors.

Read more

@Copyright 2024 by tradinglounge.com

Contact Us

Australian no: 02 4787 6020

International no: +61 (2) 47876020

Pay with:

Find us on