25Jun

Bullish Elliott Wave Analysis for Dell Technologies Reveals $130 Target on Daily & Intraday Charts—Key Forecast for DELL Stock Performance

In-Depth Elliott Wave Breakdown for Dell Technologies Inc. (DELL)

This technical analysis on Dell Technologies Inc. (NASDAQ: DELL) using Elliott Wave Theory shows a strong bullish impulse pattern developing across both daily and intraday timeframes.

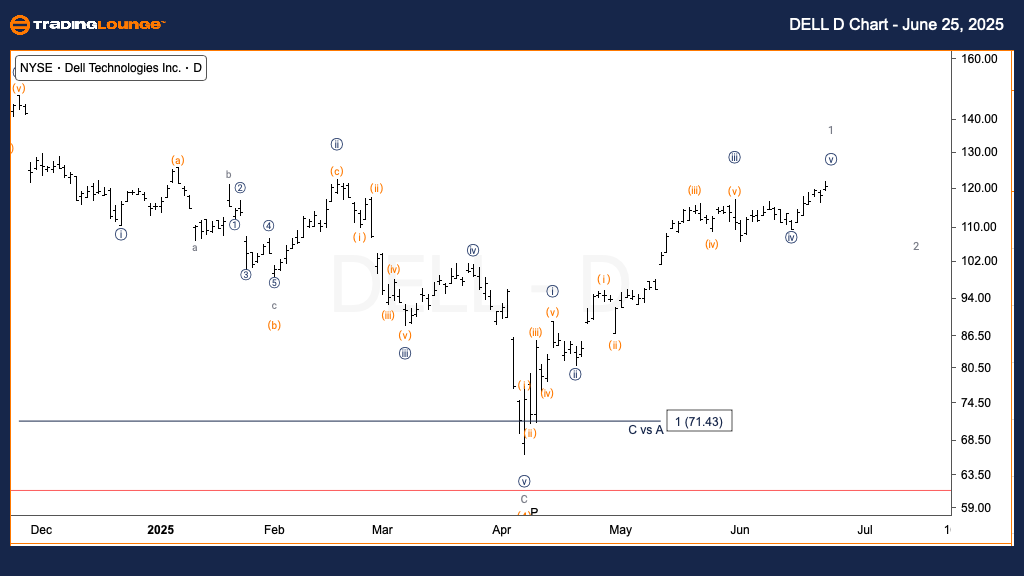
DELL Elliott Wave Forecast – Trading Lounge Daily Chart

Dell Technologies Inc. (DELL) – Daily Chart Analysis

Updated Elliott Wave Technical Analysis for DELL

FUNCTION: Trend

MODE: Motive

STRUCTURE: Impulsive

POSITION: Advancing in Wave {v} of 1

DIRECTION: Bullish move in Wave {v}

DETAILS: Dell Technologies is actively progressing through Wave {v}, with bullish momentum aiming for the Minor Group1 resistance zone near $130.

Daily Chart Analysis – Advancing Through Primary Wave 1

The daily chart reveals that Dell is progressing within Primary Wave 1, now unfolding its final leg: Wave {v}. With bullish momentum intact, price action is aiming for the $130 resistance, in line with the Minor Group1 zone. The impulsive wave structure remains stable, validating continued upside potential.

DELL-Day-Chart-25062...


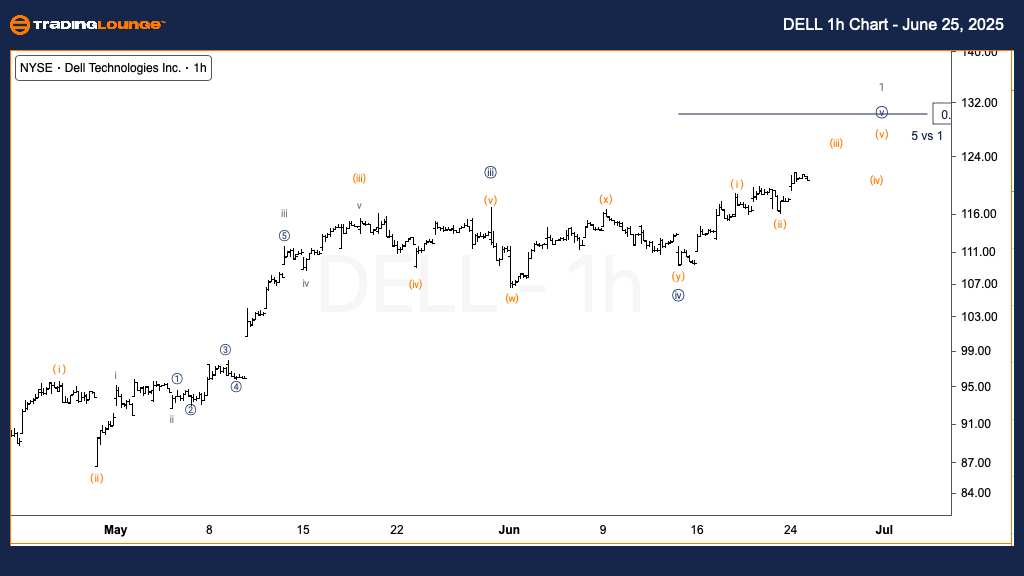
Dell Technologies Inc. (DELL) Elliott Wave Technical Analysis  – 1H Chart

Updated Elliott Wave Technical Analysis for DELL

FUNCTION: Trend

MODE: Motive

STRUCTURE: Impulsive

POSITION: Wave (iii) forming within Wave {v}

DIRECTION: Continued upward trend in Wave {v}

DETAILS: Wave (ii) of {v} appears complete, indicating a potential move higher toward the $130 level. The 61.8% Fibonacci extension of Wave {v} relative to Wave {i} supports this bullish target.

1-Hour Chart Analysis – Bullish Wave (iii) in Motion

Short-term chart analysis suggests Wave (ii) of {v} has concluded. Dell is likely entering Wave (iii), typically characterized by increased upward acceleration. The Fibonacci 61.8% extension projection for Wave {v} relative to Wave {i} also points to a price objective around $130, aligning with the resistance observed in the daily timeframe.

Technical Analyst: Alessio Barretta

Source: Visit Tradinglounge.com and learn from the Experts. Join TradingLounge Here 

Previous: Pepsico Inc. (PEP) Elliott Wave Technical Analysis

VALUE Offer - $1 for 2 Weeks then $29 a month!Click here

Access 7 Analysts Over 200 Markets Covered. Chat Room With Support

DELL-1h-Chart-250625

Related

Commodity Markets: BITCOIN, BONDS, YIELDS, DOLLAR, GOLD, SILVER, ORE, OIL, COPPER, GAS, Elliott Wave

Commodity Markets: BITCOIN, BONDS, YIELDS, DOLLAR, GOLD, SILVER, ORE, OIL, COPPER, GAS, Elliott Wave

The latest Elliott Wave Analysis for the commodity market suggests a positive trajectory for cryptoc...

Read More >
Corn Price Forecast: Elliott Wave Technical Analysis and Market Trends

Corn Price Forecast: Elliott Wave Technical Analysis and Market Trends

Discover how corn prices are moving with a detailed Elliott Wave analysis, offering insights into cu...

Read More >
Unveiling Dynamics EURUSD's Elliott Wave Technical Analysis: Navigating Impulsive Trends

Unveiling Dynamics EURUSD's Elliott Wave Technical Analysis: Navigating Impulsive Trends

In the analysis of the Euro/U.S. Dollar (EURUSD) currency pair through Elliott Wave principles on bo...

Read More >
Unlocking ASX Trading Success: REECE LIMITED - REH Stock Analysis & Elliott Wave Technical Forecast

Unlocking ASX Trading Success: REECE LIMITED - REH Stock Analysis & Elliott Wave Technical Forecast

This article provides an in-depth Elliott Wave technical analysis of Reece Limited (ASX: REH), offer...

Read More >
S&P BSE Sensex (India) Elliott Wave Analysis: Bullish Trend Forecast, Impulse Wave Patterns, Stock Market Outlook & Trading Strategy

S&P BSE Sensex (India) Elliott Wave Analysis: Bullish Trend Forecast, Impulse Wave Patterns, Stock Market Outlook & Trading Strategy

Elliott Wave forecast for the S&P BSE Sensex, covering both daily and weekly charts. It confirms a b...

Read More >

$1 for 2 Weeks

then $29 a month!

What a Special Offer!

Trade Recommendations

Unleash the power of deversified trading with our comprehensive portfolio, covering 250+ markets:

  • Stock Trades
  • Crypto Trades
  • Forex Trades
  • Commodity Trades
Elliott Wave Analysis

Gain a competitive edge with expert insights and AI-powered Elliott Wave charting into:

  • Global Indices
  • US Stocks & ASX Stocks
  • Forex & Crypto
  • Commodities
Top-Notch Trading Tools

Equip yourself with the tools of success:

  • Real-time Chat rooms
  • Elliott Wave Algorithm
  • Portfolio tools
  • TradingLevels
  • Screener
  • Trading Game
7 Elliott Wave Analysts

Stay ahead of the market with daily charts and insightful videos
Your secret to strategic trading!

JOIN HERE


Welcome to TradingLounge (ASIC A.R.No. 321187), specialists in trades, trading education and technical analysis, covering stocks, indices, commodities, forex and cryptocurrencies.

When you join TradingLounge you have access to everything we offer, including trade tools, educational content and a social platform to chat with like-minded investors.

Read more

@Copyright 2024 by tradinglounge.com

Contact Us

Australian no: 02 4787 6020

International no: +61 (2) 47876020

Pay with:

Find us on