Pepsico Inc. (PEP) Elliott Wave Forecast - Tradinglounge Daily Chart
PEP Elliott Wave Technical Analysis
FUNCTION: Trend
MODE: Impulsive
STRUCTURE: Motive
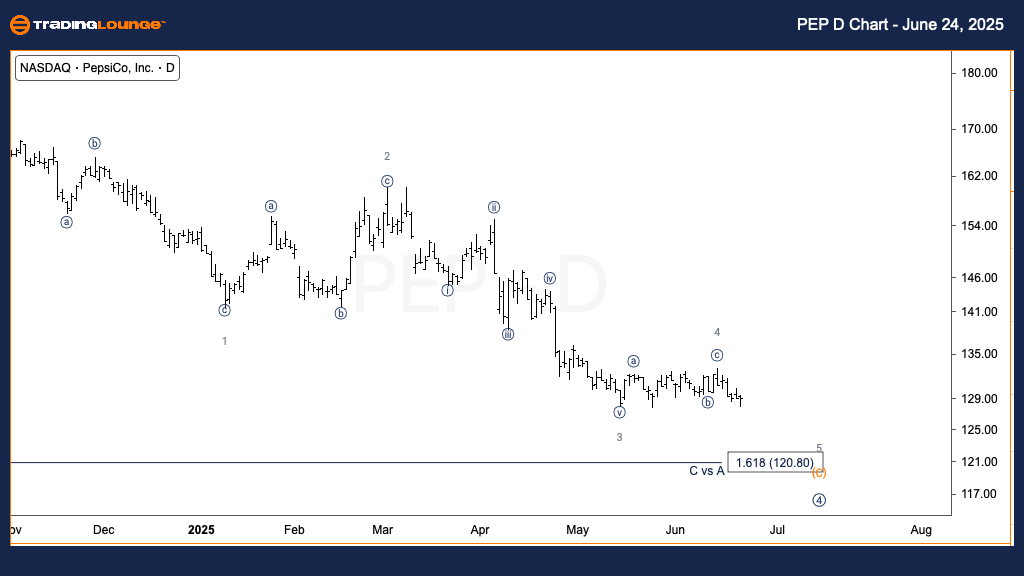
POSITION: Wave (C) of 4
DIRECTION: Downside in Wave (C)
DETAILS:
The bearish trajectory in Wave (C) is expected to continue, with a downside target near $100. Current market behavior supports this downward wave development.
According to daily Elliott Wave analysis for Pepsico Inc. (PEP), the stock remains in a corrective phase as part of Intermediate Wave 4, evolving in a classic zigzag pattern (A)-(B)-(C). Wave (C) is actively progressing and displays an impulsive wave structure. This setup points to further bearish pressure, aligning with a projected move toward the $100 level—confirming the corrective cycle's momentum.
Pepsico Inc. (PEP) Elliott Wave Forecast - Tradinglounge 1H Chart
PEP Elliott Wave Technical Analysis
FUNCTION: Trend
MODE: Impulsive
STRUCTURE: Motive
POSITION: Wave {i} of 5
DIRECTION: Downside within Wave 5
DETAILS:
Wave {i} of 5 is likely complete. A corrective pattern forming Wave {ii} is anticipated before the trend resumes downward into Wave {iii}.
The 1-hour Elliott Wave forecast for PEP confirms a bearish setup. Wave {i} of 5 appears to have finalized its five-wave decline. A three-wave retracement forming Wave {ii} is expected next. Following this correction, Wave {iii} should initiate, driving further downside within the larger Wave (C) framework—reinforcing the medium-term bearish trend.
Technical Analyst: Alessio Barretta
Source: Visit Tradinglounge.com and learn from the Experts. Join TradingLounge Here
Previous: JP Morgan & Chase Co. (JPM) Elliott Wave Technical Analysis
VALUE Offer - Buy 1 Month & Get 3 Months!Click here
Access 7 Analysts Over 200 Markets Covered. Chat Room With Support
