GX Uranium ETF Commodity Elliott Wave Analysis

The GX URA ETF (Global X Uranium ETF) tracks the performance of companies within the uranium industry. This ETF provides investors with a diversified portfolio that includes firms engaged in uranium mining, exploration, and production across the globe. As nuclear energy increasingly gains recognition as a cleaner power alternative, the demand for uranium is expected to grow, making the GX URA ETF an appealing option for investors seeking exposure to the sector's potential growth.

The price completed its bearish corrective cycle in August 2024, following a decline that started in May of the same year. After completing this cycle, the commodity rallied sharply, confirming a shift into a bullish phase. The current expectation is for the commodity to break above the May 2024 high, potentially reaching its highest price level in over a decade.

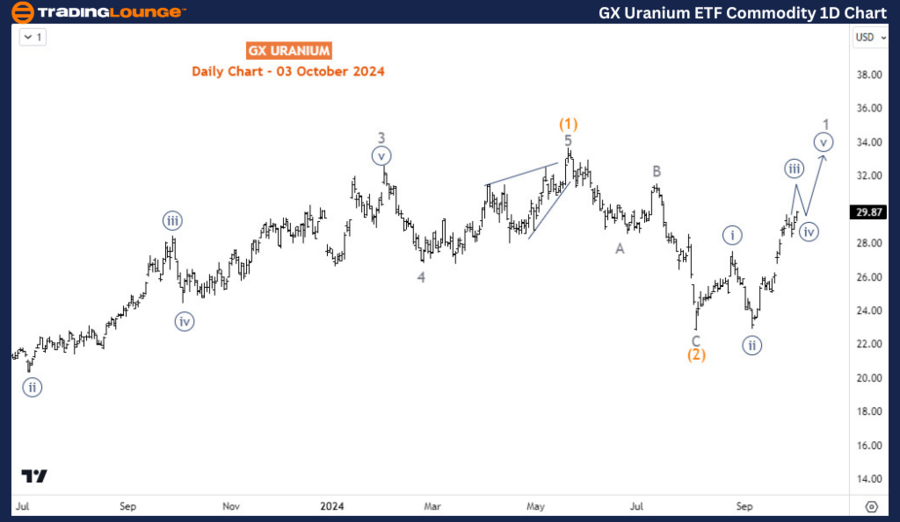
GX Uranium ETF Commodity Long-Term Analysis

From a long-term perspective, the GX URA ETF appears to be in a bullish corrective cycle. Between February 2011 and March 2020, the ETF consistently declined, creating lower lows and lower highs, resembling an impulse wave structure. Since the March 2020 low, the price has been correcting the long-term bearish trend.

  • In November 2021, an impulse wave sequence completed for wave A (circled) of the primary degree.

  • The ETF then experienced a corrective pullback for wave B (circled), which concluded in July 2022.
  • Following this, an impulse wave finished for wave (1) of C (circled) in May 2024, and a pullback followed for wave (2) as displayed on the daily chart.
  • The ongoing rally, which began on August 5, 2024, is likely wave 1 of (3). Since wave 1 is still incomplete, there is significant room for buyers to drive the long-term recovery further.

GX-Uranium-ETF-Commo...


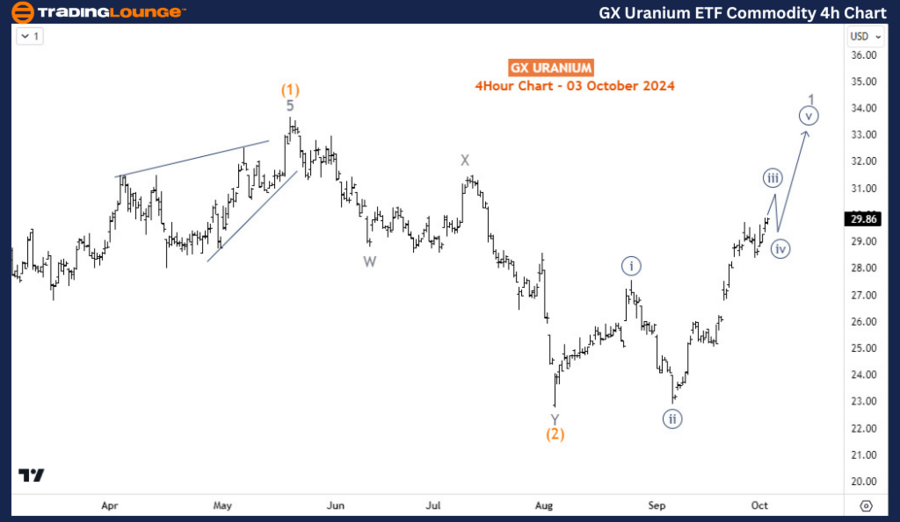
GX Uranium ETF Commodity H4 Chart Analysis

On the H4 chart, the price is currently within wave ((iii)) of 1 and may extend higher before experiencing a pullback for wave ((iv)), at which point buyers are expected to re-enter the market. Traders can look for buying opportunities during the dip, once wave ((iv)) or wave 2 completes in the near term.

Technical Analyst: Sanmi Adeagbo

Source: visit Tradinglounge.com and learn From the Experts Join TradingLounge Here 

See Previous: Natural Gas Elliott Wave Technical Analysis

VALUE Offer - Buy 1 Month & Get 3 Months!Click here

Access 7 Analysts Over 200 Markets Covered. Chat Room With Support

GX-Uranium-ETF-Commo...

Related

AMCOR PLC – AMC Elliott Wave Forecast Reveals Bullish Wave 3 Setup with Price Targets, Stock Analysis, and Trading Strategy

AMCOR PLC – AMC Elliott Wave Forecast Reveals Bullish Wave 3 Setup with Price Targets, Stock Analysis, and Trading Strategy

AMCOR PLC (ASX: AMC) uses Elliott Wave Theory to forecast a potential bullish trend. With Wave (2) c...

Read More >
Cocoa Commodity Elliott Wave Technical Analysis: Navigating Current Trends and Future Possibilities

Cocoa Commodity Elliott Wave Technical Analysis: Navigating Current Trends and Future Possibilities

Discover the latest insights into the cocoa market with our in-depth Elliott Wave analysis. Learn ab...

Read More >
Dogecoin / U.S. dollar(DOGEUSD) Elliott Wave Technical Analysis 20 December 23

Dogecoin / U.S. dollar(DOGEUSD) Elliott Wave Technical Analysis 20 December 23

TradingLounge Elliott Wave Technical 4-Hour and day chart Analysis of Dogecoin / U.S. dollar(DOGEUSD...

Read More >
Learn About The REA GROUP LTD – REA Stock Analysis & Elliott Wave Technical Forecast: ASX Trading Success

Learn About The REA GROUP LTD – REA Stock Analysis & Elliott Wave Technical Forecast: ASX Trading Success

Explore our detailed Elliott Wave analysis for REA Group on the Australian Stock Exchange (ASX). Lea...

Read More >
Profitable HSI Trading with Hang Seng Index Elliott Wave Technical Analysis, HSI Market Trends, and Top Investment Tips

Profitable HSI Trading with Hang Seng Index Elliott Wave Technical Analysis, HSI Market Trends, and Top Investment Tips

This article provides an in-depth Hang Seng trading and HSI analysis, offering insights into Elliott...

Read More >
Axis Bank ltd. Elliott WaveTechnical Analysis: Stock Price Forecast, Resistance Levels, and Trading Strategy

Axis Bank ltd. Elliott WaveTechnical Analysis: Stock Price Forecast, Resistance Levels, and Trading Strategy

This article provides an in-depth Elliott Wave analysis of Axis Bank's stock, including technica...

Read More >

Buy 1 Month

Get 3 Months!

Special Offer:

Trade Recommendations

Unleash the power of deversified trading with our comprehensive portfolio, covering:

  • Stock Trades
  • Crypto Trades
  • Forex Trades
  • Commodity Trades
Elliott Wave Analysis

Gain a competive edge with expert insights in to:

  • Global Indices
  • US Stocks & ASX Stocks
  • Forex & Crypto
  • Commodities
Top-Notch Trading Tools

Equip yourself with the tools of success:

  • Social Chat
  • Elliott Wave Algorithm
  • Screener
  • TradingLevels
  • Trading Game
7 Elliott Wave Analysts

Stay ahead of the market with daily charts and insightful videos
-Your secret to strategic trading!

JOIN HERE


Welcome to TradingLounge (ASIC A.R.No. 321187), specialists in trades, trading education and technical analysis, covering stocks, indices, commodities, forex and cryptocurrencies.

When you join TradingLounge you have access to everything we offer, including trade tools, educational content and a social platform to chat with like-minded investors.

Read more

@Copyright 2024 by tradinglounge.com

Contact Us

Australian no: 02 4787 6020

International no: +61 (2) 47876020

Pay with:

Find us on