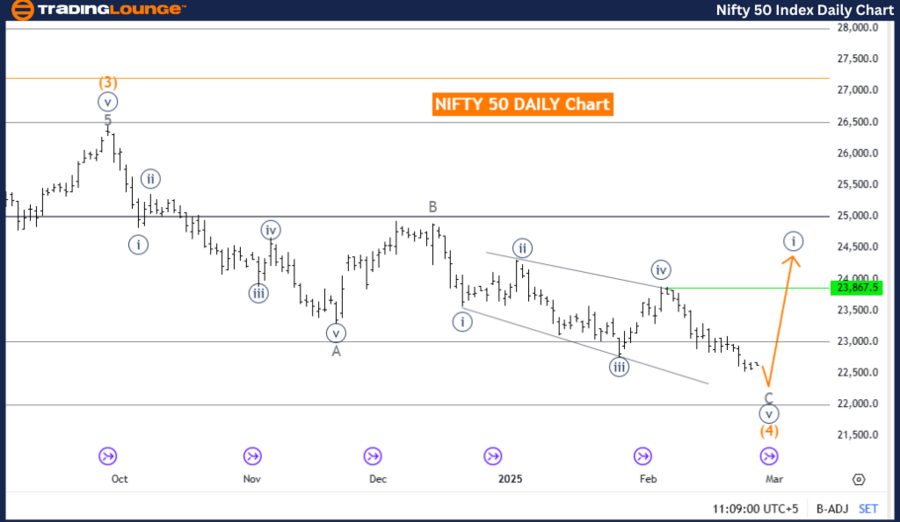
NIFTY 50 (India) Elliott Wave Analysis – Trading Lounge Day Chart
NIFTY 50 (India) Wave Technical Analysis
Function: Counter Trend
Mode: Impulsive
Structure: Navy Blue Wave 5
Position: Gray Wave C
Direction Next Higher Degrees: Navy Blue Wave 1
Analysis Details
The NIFTY 50 Elliott Wave Analysis for the daily chart indicates a counter-trend phase, demonstrating an impulsive wave structure within the market.
Currently, Navy Blue Wave 5 is active, forming part of a broader corrective pattern within Gray Wave C. This phase suggests that the market is in a strong bullish momentum, aligning with the characteristics of an impulsive wave.
The next anticipated movement in the Elliott Wave cycle is Navy Blue Wave 1, which is expected to emerge after the completion of Navy Blue Wave 5.
Key Observations
- Navy Blue Wave 4 appears to have concluded, and the market is progressing within Navy Blue Wave 5 of Gray Wave C.
- This impulsive wave phase is expected to sustain strong upward momentum.
- Traders should monitor the progress of Navy Blue Wave 5, as its completion will signal the potential start of Navy Blue Wave 1, aligning with the larger market trend.
Conclusion
The NIFTY 50 is currently experiencing an impulsive phase within its Elliott Wave structure, with Navy Blue Wave 5 in progress after the completion of Navy Blue Wave 4. This phase is an integral part of Gray Wave C, with the next significant move expected to be Navy Blue Wave 1.
Traders should keep a close watch on the completion of Navy Blue Wave 5, as it will provide crucial insights into the timing and direction of the next higher-degree wave.
This analysis underscores the significance of understanding Elliott Wave structures to anticipate market trends and optimize trading strategies effectively.
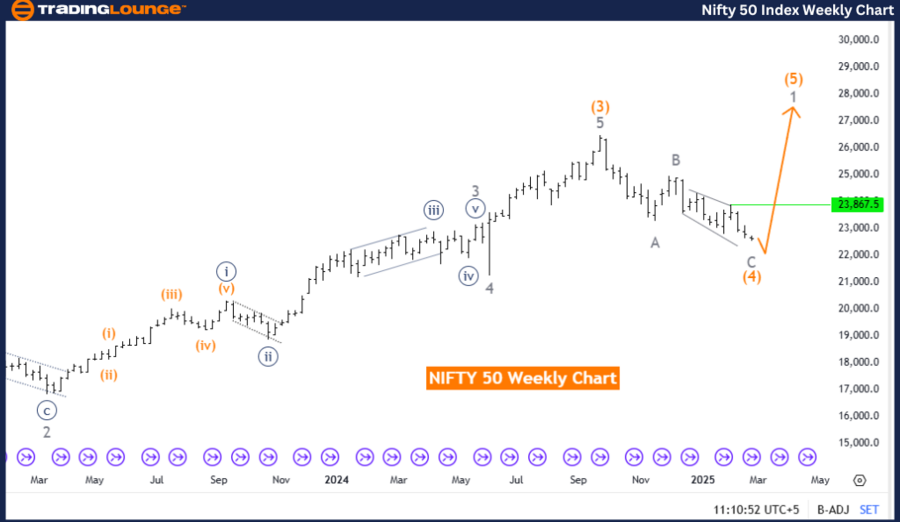
NIFTY 50 (India) Elliott Wave Analysis – Trading Lounge Weekly Chart
NIFTY 50 (India) Wave Technical Analysis
Function: Counter Trend
Mode: Impulsive
Structure: Gray Wave C
Position: Orange Wave 4
Direction Next Higher Degrees: Gray Wave 1 of 5
Analysis Details
The NIFTY 50 Elliott Wave Analysis for the weekly chart reveals a counter-trend phase, highlighting an impulsive wave movement within the market structure.
At present, the market is navigating Gray Wave C, which is a component of a larger corrective phase within Orange Wave 4. This indicates that the market is in a strong bullish trend, consistent with the characteristics of an impulsive wave.
The next anticipated major wave movement is Gray Wave 1 of 5, which is expected to develop following the conclusion of Gray Wave C.
Key Observations
- Gray Wave C of Orange Wave 4 is currently unfolding and appears to be approaching its final stages.
- This wave is anticipated to maintain strong upward momentum, consistent with the impulsive nature of the trend.
- Traders should carefully track Gray Wave C, as its completion will indicate the potential onset of Gray Wave 1 of 5, aligning with the larger market trend.
Conclusion
The NIFTY 50 is in the midst of an impulsive wave phase, with Gray Wave C developing within Orange Wave 4.
This impulsive movement is nearing completion, and the next anticipated wave is Gray Wave 1 of 5.
Traders should closely follow the final stages of Gray Wave C, as its completion will provide essential insights into the next major market movement.
This analysis reinforces the importance of Elliott Wave Theory in forecasting potential market trends and enhancing trading strategies.
Technical Analyst: Malik Awais
Source: visit Tradinglounge.com and learn From the Experts Join TradingLounge Here
Previous: KOSPI Composite Elliott Wave Technical Analysis
VALUE Offer - Buy 1 Month & Get 3 Months!Click here
Access 7 Analysts Over 200 Markets Covered. Chat Room With Support