18Nov

Elliott Wave Analysis for JP Morgan & Chase Co. (JPM), Focusing on Both Saily and 1-Hour Charts, Highlights Key Trading Levels

Elliott Wave Analysis for JP Morgan & Chase Co. (JPM): Daily and 1-Hour Charts

This detailed Elliott Wave analysis examines the daily and 1-hour charts of JP Morgan & Chase Co. (JPM). By leveraging Elliott Wave Theory, we aim to provide insights into the current market trends and predict potential price movements.


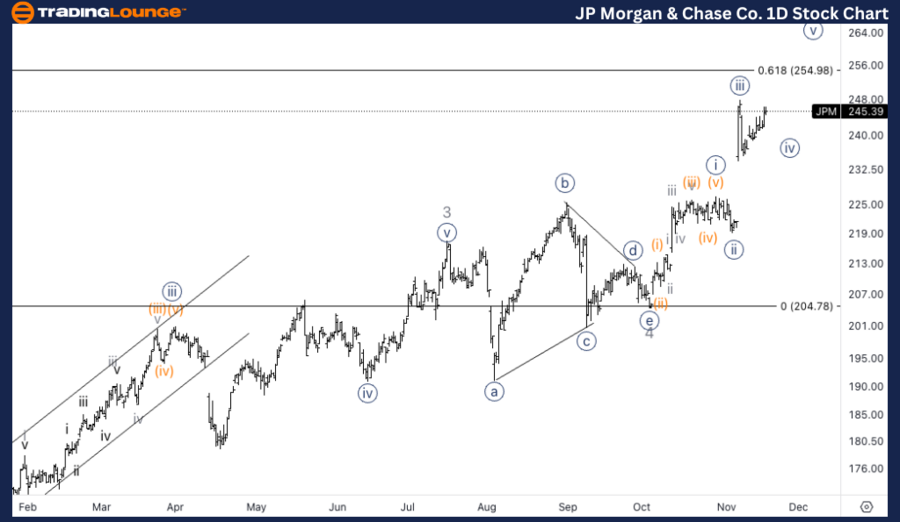
JPM Elliott Wave Analysis - TradingLounge Daily Chart

JP Morgan & Chase Co. (JPM) Daily Chart Analysis

JPM Elliott Wave Technical Analysis

Function: Trend

Mode: Impulsive

Structure: Motive

Position: Minor wave 5

Direction: Upside in 5 of (5)

Details: JPM is currently trading above TradingLevel2 at $200, indicating strong bullish momentum within Minor wave 5. The next key target is TradingLevel3 at $300, which could act as a critical resistance level.

JPM Elliott Wave Technical Analysis – Daily Chart

On the daily chart, JP Morgan & Chase Co. (JPM) is advancing within Minor wave 5 of the larger wave (5). The breakout above TradingLevel2 at $200 reflects a robust uptrend. The next technical and psychological resistance level to monitor is $300, which could pose a challenge for further upside momentum.

JP-Morgan-&-Chase-Co...


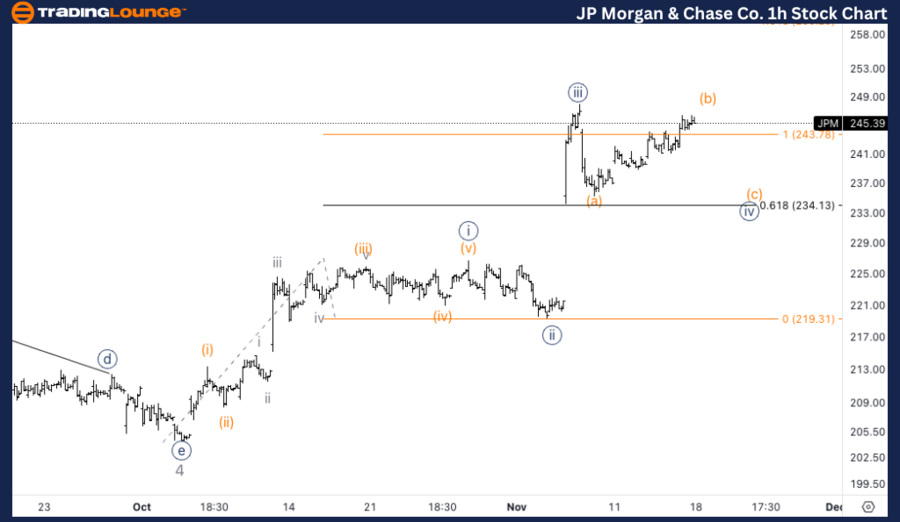
JPM Elliott Wave Analysis - TradingLounge 1-Hour Chart

JP Morgan & Chase Co. (JPM) 1H Chart Analysis

JPM Stock Technical Analysis

Function: Trend

Mode: Impulsive

Structure: Motive

Position: Wave {iv} of 5

Direction: Bottom in wave {iv}

Details: JPM is anticipated to complete a corrective phase within wave {iv}. A sharp decline, identified as potential wave (a), was followed by a corrective rally in wave (b). A further downside move in wave (c) of {iv} is expected, with MinorGroup1 likely to act as strong support.

JPM Technical Analysis – 1H Chart

On the 1-hour chart, JPM appears to be completing wave {iv} within Minor wave 5. The initial decline (wave (a)) has been followed by a corrective bounce (wave (b)). A final move lower in wave (c) is anticipated to complete wave {iv}. MinorGroup1 is expected to hold as a support zone, potentially marking the end of wave {iv} before the bullish trend resumes in wave {v}.

Technical Analyst: Alessio Barretta

Source: visit Tradinglounge.com and learn From the Experts Join TradingLounge Here 

See Previous: Berkshire Hathaway Inc. Elliott Wave Technical Analysis

VALUE Offer - Buy 1 Month & Get 3 Months!Click here

Access 7 Analysts Over 200 Markets Covered. Chat Room With Support

JP-Morgan-&-Chase-Co...

Related

U.S.Dollar/Swiss Franc (USD/CHF) Forex Elliott Wave Technical Analysis: Precise Forex Trading Strategies

U.S.Dollar/Swiss Franc (USD/CHF) Forex Elliott Wave Technical Analysis: Precise Forex Trading Strategies

This article provides a comprehensive USD/CHF Elliott Wave Analysis, detailing impulsive wave patter...

Read More >
TASI Index Elliott Wave Analysis: Bullish Trend Forecast and Key Invalidation Level Insights

TASI Index Elliott Wave Analysis: Bullish Trend Forecast and Key Invalidation Level Insights

The TASI Index is currently in a strong bullish phase, as identified by Elliott Wave analysis. With ...

Read More >
KOSPI Composite Index Elliott Wave Technical Analysis: Bullish Wave 3 Forecast & Trading Strategy for South Korea’s Stock Market

KOSPI Composite Index Elliott Wave Technical Analysis: Bullish Wave 3 Forecast & Trading Strategy for South Korea’s Stock Market

This article offers a detailed Elliott Wave analysis of the KOSPI Composite Index, highlighting a bu...

Read More >
Providing a Well-Rounded View of Salesforce's Stock Performance and Forecast: Salesforce Inc (CRM) Elliott Wave Analysis

Providing a Well-Rounded View of Salesforce's Stock Performance and Forecast: Salesforce Inc (CRM) Elliott Wave Analysis

This analysis provides a comprehensive look at Salesforce (CRM) stock using Elliott Wave Theory. It ...

Read More >
Visa Inc. (V) Stock Elliott Wave Analysis: Bullish Trend Insights, Price Forecasts, Wave 5 Targets, and Key Support

Visa Inc. (V) Stock Elliott Wave Analysis: Bullish Trend Insights, Price Forecasts, Wave 5 Targets, and Key Support

Visa Inc. stock is currently navigating through Elliott Wave patterns, with Wave {ii} of 5 showing b...

Read More >

$1 for 2 Weeks

then $29 a month!

What a Special Offer!

Trade Recommendations

Unleash the power of deversified trading with our comprehensive portfolio, covering 250+ markets:

  • Stock Trades
  • Crypto Trades
  • Forex Trades
  • Commodity Trades
Elliott Wave Analysis

Gain a competitive edge with expert insights and AI-powered Elliott Wave charting into:

  • Global Indices
  • US Stocks & ASX Stocks
  • Forex & Crypto
  • Commodities
Top-Notch Trading Tools

Equip yourself with the tools of success:

  • Real-time Chat rooms
  • Elliott Wave Algorithm
  • Portfolio tools
  • TradingLevels
  • Screener
  • Trading Game
7 Elliott Wave Analysts

Stay ahead of the market with daily charts and insightful videos
Your secret to strategic trading!

JOIN HERE


Welcome to TradingLounge (ASIC A.R.No. 321187), specialists in trades, trading education and technical analysis, covering stocks, indices, commodities, forex and cryptocurrencies.

When you join TradingLounge you have access to everything we offer, including trade tools, educational content and a social platform to chat with like-minded investors.

Read more

@Copyright 2024 by tradinglounge.com

Contact Us

Australian no: 02 4787 6020

International no: +61 (2) 47876020

Pay with:

Find us on