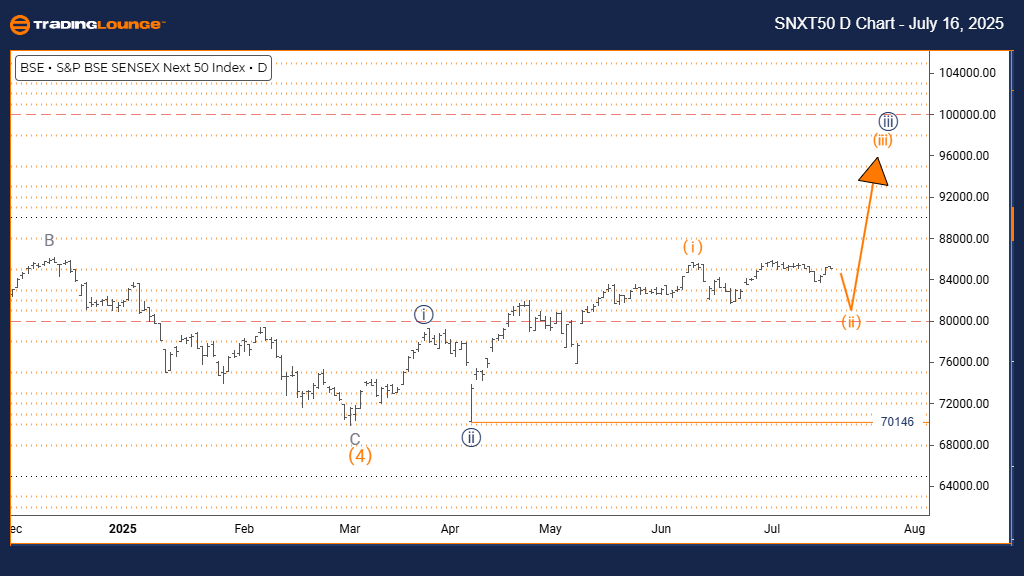
S&P BSE SENSEX NEXT 50 Elliott Wave Analysis – Trading Lounge Day Chart
S&P BSE SENSEX NEXT 50 Elliott Wave Technical Analysis
Function: Bullish Market Trend
Mode: Impulsive Structure
Wave Pattern: Orange Wave 3 Development
Wave Position: Inside Navy Blue Wave 3
Higher Degree Direction: Ongoing Orange Wave 3
Details: Orange Wave 2 has finished; Orange Wave 3 is underway
Wave Invalidation Level: 70146
The daily Elliott Wave analysis for S&P BSE SENSEX NEXT 50 indicates a strong bullish structure supported by a clear impulsive move. Orange Wave 3 is developing within Navy Blue Wave 3, signaling the core segment of the current uptrend. With Orange Wave 2 confirmed complete, technical indicators suggest Orange Wave 3 is actively forming.
Rising momentum and higher highs point to solid buying strength. Being nested inside Navy Blue Wave 3, the ongoing structure confirms a healthy upward trend. The 70146 price point is the wave invalidation level — any move below this would require a reanalysis of the wave count.
This pattern implies the index has entered a key advancing phase. Orange Wave 3 is expected to continue gaining before a possible correction. Traders should observe momentum closely and monitor the 70146 level to ensure wave count accuracy and maintain risk control.
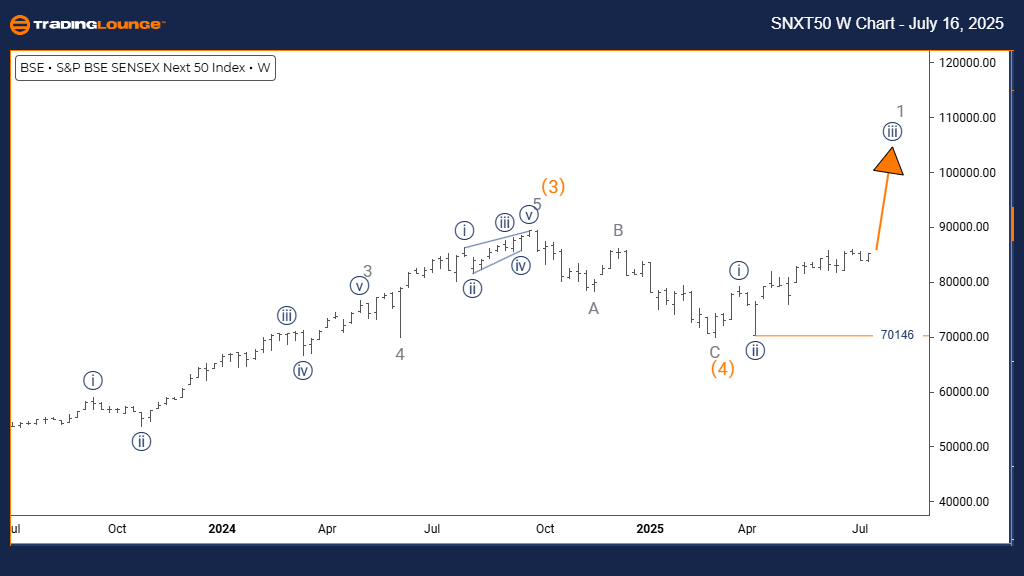
S&P BSE SENSEX NEXT 50 Elliott Wave Analysis – Trading Lounge Weekly Chart
S&P BSE SENSEX NEXT 50 Elliott Wave Technical Analysis
Function: Sustained Bullish Trend
Mode: Impulsive Price Movement
Wave Structure: Navy Blue Wave 3 Expansion
Wave Position: Part of Gray Wave 1
Lower Degree Direction: Upcoming Navy Blue Wave 4
Details: Navy Blue Wave 2 is complete; Navy Blue Wave 3 is advancing
Wave Invalidation Level: 70146
The weekly Elliott Wave forecast for S&P BSE SENSEX NEXT 50 confirms a firm bullish trajectory driven by impulsive wave progression. Navy Blue Wave 3 is taking shape inside a broader Gray Wave 1 framework, suggesting a robust beginning to a major upward phase. Technical review supports the completion of Navy Blue Wave 2, marking the start of Navy Blue Wave 3.
This wave formation reflects consistent buying power, with increased volume and ascending price action suggesting investor confidence. The structure projects further gains as part of a long-term bullish cycle. Staying above the 70146 invalidation mark is vital for trend confirmation.
Traders should expect Navy Blue Wave 3 to continue offering opportunities before transitioning into Navy Blue Wave 4. The overall bullish structure provides a solid base for aligning long positions with the prevailing market momentum.
Technical Analyst: Malik Awais
Source: Visit Tradinglounge.com and learn from the Experts. Join TradingLounge Here
Previous: Shanghai Composite Elliott Wave Technical Analysis
VALUE Offer - Buy 1 Month & Get 3 Months!Click here
Access 7 Analysts Over 200 Markets Covered. Chat Room With Support