ARK Israel Innovative Technology ETF – IZRL (1D) Elliott Wave Technical Analysis Daily Chart
ARK Israel Innovative Technology ETF – IZRL Elliott Wave Technical Analysis
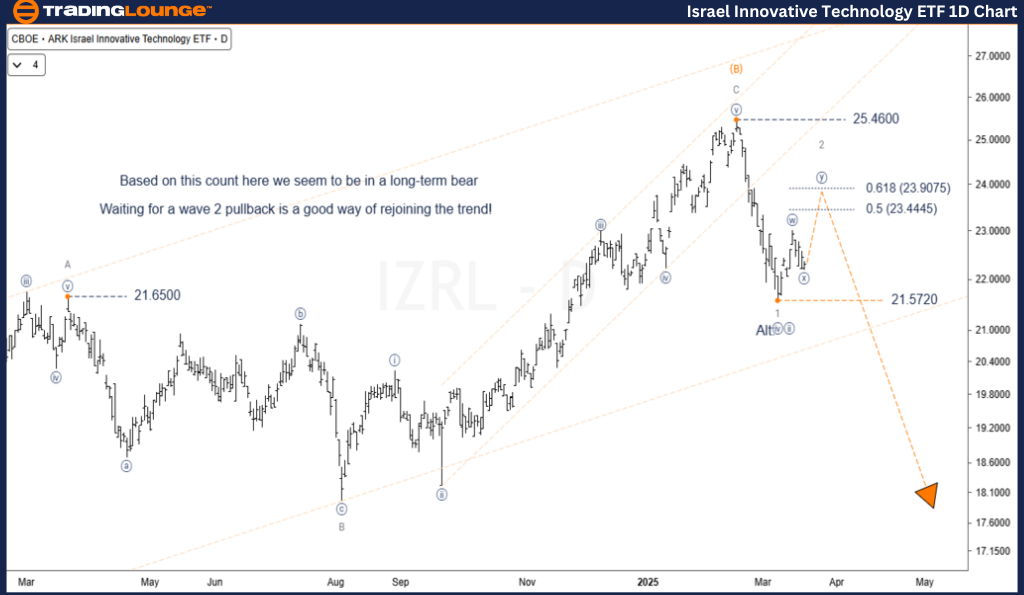
Function: Major Trend (Minor Degree - Grey)
Mode: Motive
Structure: Impulse
Position: Wave 2
Direction: Decline
Technical Outlook:
A strong rally forming wave 2 is developing within a combination pattern. This current structure fits well within the Elliott Wave analysis for IZRL. The critical price zone to monitor for this corrective phase is around $23.9000, where a potential reversal is expected.
Following the completion of wave 2, a downward move should resume, likely pushing below the previous wave 1 low and developing into five waves. These downward waves may target the wave B of (B) bottom, in line with the ARK Israel Innovative Technology ETF forecast.
Should the rally exceed the wave 1 peak, the $21.5720 level might mark wave [iv] of a longer-term extending impulse.
Invalidation Level: $25.4600
ARK Israel Innovative Technology ETF – IZRL (1W) Elliott Wave Technical Analysis Weekly Chart
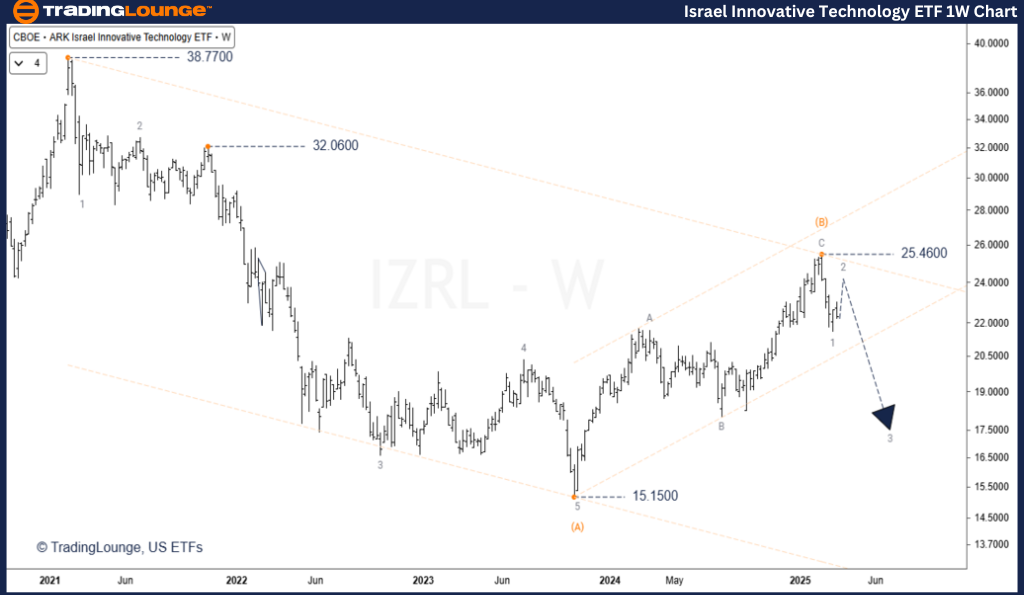
Function: Major Trend
Mode: Corrective
Structure: Zigzag
Position: Wave 2
Direction: Decline
Technical Outlook:
Currently, wave (C) orange is progressing and is forecasted to fully retrace wave (B). The downward structure should unfold in five distinct legs and is expected to appear less complex compared to wave (A).
A confirmed break below the lower channel boundary would validate the end of wave (B), adding further confirmation to the IZRL wave structure. Additional confirmation for the zigzag pattern would follow a breakdown below the $15.1500 level.
Invalidation Level: $25.4600
Technical Analyst: Siinom
Source: Visit Tradinglounge.com and learn from the Experts. Join TradingLounge Here
See Previous: SPDR Select Sector Fund ETF (XLF) Elliott Wave Technical Analysis
VALUE Offer - Buy 1 Month & Get 3 Months!Click here
Access 7 Analysts Over 200 Markets Covered. Chat Room With Support
Conclusion:
The IZRL ETF maintains a long-term bearish outlook within Elliott Wave parameters. Wave 2 is anticipated to complete near the 61.8% Fibonacci retracement, followed by a projected move below the $21.5720 level (wave 1 low).
Traders are encouraged to wait for the wave 2 correction to finish, which could provide strategic entry opportunities. Close adherence to Elliott Wave rules and careful observation of invalidation levels will help manage risk effectively.