ASX: BLOCK, INC – XYZ (SQ2) Elliott Wave Technical Analysis – TradingLounge

Greetings,
Today’s updated Elliott Wave analysis of BLOCK, INC – XYZ (SQ2) on the Australian Stock Exchange (ASX) highlights a potentially pivotal setup for traders watching this stock.

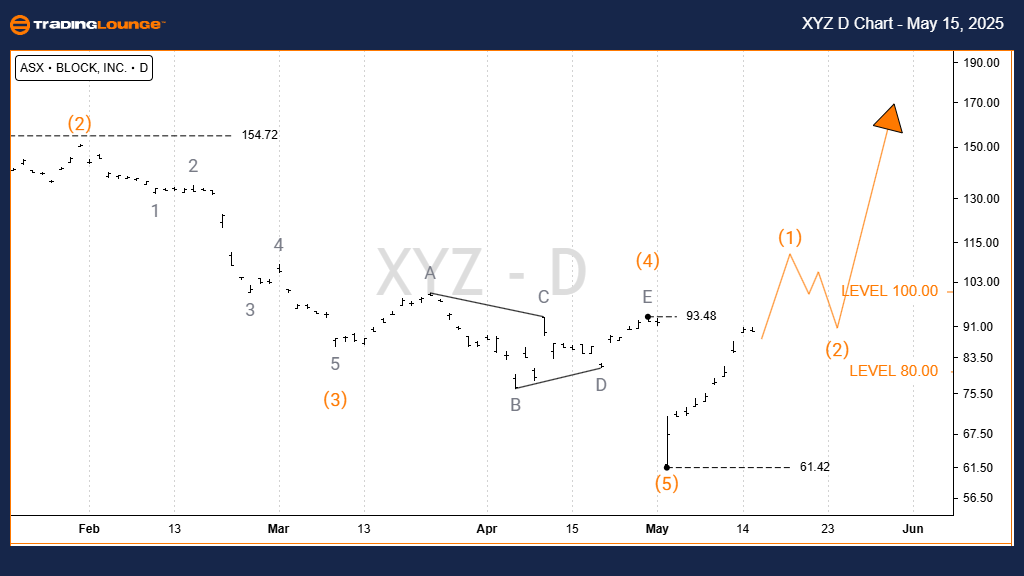
We are currently identifying a possible market bottom around 61.42, which may conclude a complete five-wave impulse decline. Presently, wave 1) – orange seems close to finishing, suggesting that a wave 2) – orange correction may develop lower. Once wave 2) is complete, it could lead to the onset of wave 3) – orange, aligning with a potential bullish trend.

ASX: BLOCK, INC – XYZ (SQ2) 1d Chart (Semilog Scale) Technical Outlook

Function: Intermediate Trend

Mode: Motive

Structure: Impulse

Position: Wave 1) – orange

Invalidation Point: 61.42

We currently view the 61.42 level as a potential terminal point for the prior decline from 154.72, indicating the end of the five-wave structure. Should this level hold, we expect a limited pullback in wave 2) – orange, followed by the development of a bullish wave 3) – orange. To confirm this scenario, the market must maintain above the critical invalidation level of 61.42.

XYZ-d-asx-chart-1505...


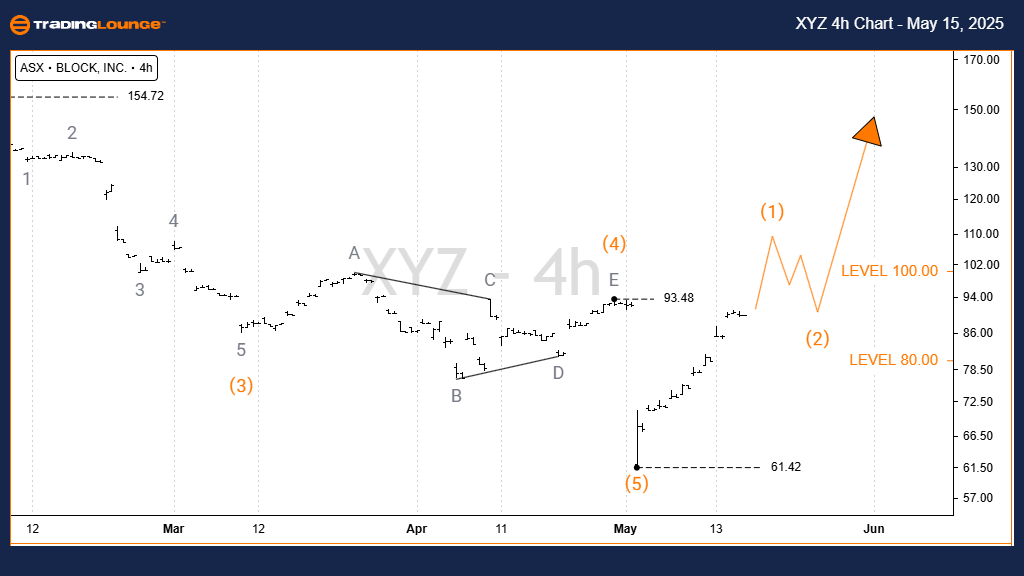
ASX: BLOCK, INC – XYZ (SQ2) 4h Chart (Semilog Scale) Technical Outlook

ASX: BLOCK, INC 4-Hour Chart Technical Analysis:

Function: Intermediate Trend

Mode: Motive

Structure: Impulse

Position: Wave 1) – orange

Invalidation Point: 61.42

The 4-hour chart also supports the hypothesis that the price bottomed at 61.42. From this level, price action could continue higher, but this is conditional upon the completion of wave 2) – orange. A clear end to this wave will increase the probability of an advance into wave 3) – orange, pointing toward a renewed bullish momentum.

Technical Analyst: Hua (Shane) Cuong, CEWA-M (Master’s Designation).

Source: Visit Tradinglounge.com and learn from the Experts. Join TradingLounge Here 

See Previous: NEWMONT CORPORATION – NEM Elliott Wave Technical Analysis

VALUE Offer - Buy 1 Month & Get 3 Months!Click here

Access 7 Analysts Over 200 Markets Covered. Chat Room With Support

XYZ-4h-asx-chart-150...


Conclusion:

The Elliott Wave forecast for BLOCK, INC – XYZ (SQ2) outlines a key technical inflection at the 61.42 support level. Maintaining this level is essential for validating the transition from wave 2) to wave 3). Traders should watch this level closely as it offers insights into the strength and direction of the upcoming trend.

Related

Shanghai Composite Elliott Wave Analysis: Unlock Market Trends, Predict Future Moves & Maximize Your Trading Profits!

Shanghai Composite Elliott Wave Analysis: Unlock Market Trends, Predict Future Moves & Maximize Your Trading Profits!

This Shanghai Composite Elliott Wave Analysis provides a detailed outlook on the current stock marke...

Read More >
Shanghai Composite Elliott Wave Analysis: Discover Market Trends, and Trading Strategies for Smarter Investment Decisions

Shanghai Composite Elliott Wave Analysis: Discover Market Trends, and Trading Strategies for Smarter Investment Decisions

Shanghai Composite Elliott Wave analysis focuses on market trends, impulse waves, corrective waves, ...

Read More >
U.S.Dollar/Swiss Franc(USDCHF) Elliott Wave Technical Analysis 23 January 24

U.S.Dollar/Swiss Franc(USDCHF) Elliott Wave Technical Analysis 23 January 24

Trading Lounge Day Chart for USDCHF Elliott Wave Analysis dated 23 January 24, delves into the intri...

Read More >
Unlocking ASX Trading Success: V300AEQ ETF UNITS – VAS Stock Analysis & Elliott Wave Technical Forecast

Unlocking ASX Trading Success: V300AEQ ETF UNITS – VAS Stock Analysis & Elliott Wave Technical Forecast

This article provides a detailed Elliott Wave analysis of the ASX V300AEQ ETF Units - VAS. It includ...

Read More >
Forex Pair USDCAD Elliott Wave Forecast: Bearish Impulse Wave 3 Extends – Risk Levels, and Resistance Targets Identified

Forex Pair USDCAD Elliott Wave Forecast: Bearish Impulse Wave 3 Extends – Risk Levels, and Resistance Targets Identified

USDCAD shows a strong bearish Elliott Wave impulse on both daily and 4-hour charts. Wave 3 is in mot...

Read More >
The Boeing Company (BA) Stock Forecast Using Elliott Wave Analysis Shows Bullish Trend with Key Resistance at $200 and Wave 1 Formation

The Boeing Company (BA) Stock Forecast Using Elliott Wave Analysis Shows Bullish Trend with Key Resistance at $200 and Wave 1 Formation

Boeing stock is showing early signs of a bullish trend with Elliott Wave analysis identifying a new ...

Read More >

$1 for 2 Weeks

then $29 a month!

What a Special Offer!

Trade Recommendations

Unleash the power of deversified trading with our comprehensive portfolio, covering 250+ markets:

  • Stock Trades
  • Crypto Trades
  • Forex Trades
  • Commodity Trades
Elliott Wave Analysis

Gain a competitive edge with expert insights and AI-powered Elliott Wave charting into:

  • Global Indices
  • US Stocks & ASX Stocks
  • Forex & Crypto
  • Commodities
Top-Notch Trading Tools

Equip yourself with the tools of success:

  • Real-time Chat rooms
  • Elliott Wave Algorithm
  • Portfolio tools
  • TradingLevels
  • Screener
  • Trading Game
7 Elliott Wave Analysts

Stay ahead of the market with daily charts and insightful videos
Your secret to strategic trading!

JOIN HERE


Welcome to TradingLounge (ASIC A.R.No. 321187), specialists in trades, trading education and technical analysis, covering stocks, indices, commodities, forex and cryptocurrencies.

When you join TradingLounge you have access to everything we offer, including trade tools, educational content and a social platform to chat with like-minded investors.

Read more

@Copyright 2024 by tradinglounge.com

Contact Us

Australian no: 02 4787 6020

International no: +61 (2) 47876020

Pay with:

Find us on