Elliott Wave Analysis for The Coca-Cola Company (KO) – August 13, 2024
Welcome to our detailed Elliott Wave analysis for The Coca-Cola Company (KO) as of August 13, 2024. This report offers a thorough examination of KO's price movements through the lens of Elliott Wave Theory, guiding traders to spot potential opportunities based on the latest trends and market structure. We provide insights from both daily and 1-hour charts to give a complete overview of KO's market behaviour.
TradingLounge Stock KO Elliott Wave Analysis – Daily Chart
The Coca-Cola Company (KO) Daily Chart Analysis
KO Elliott Wave Technical Analysis
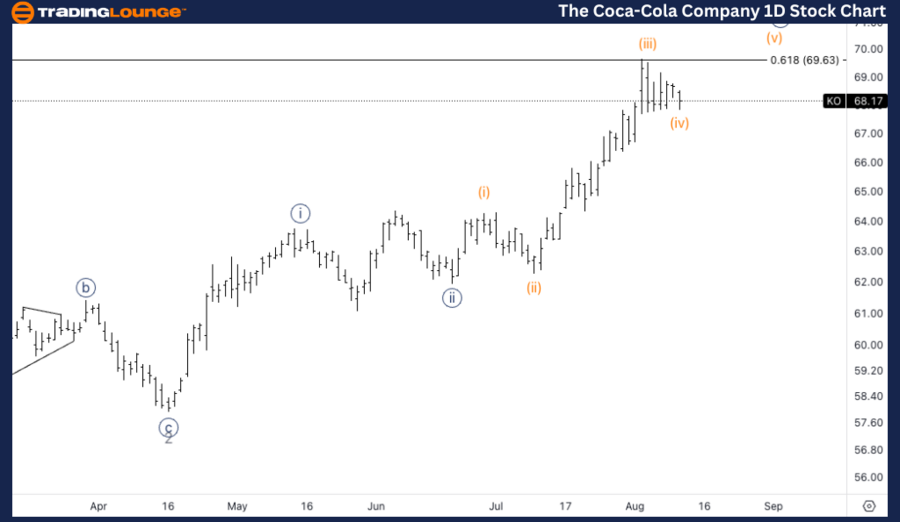
Function: Counter Trend
Mode: Corrective
Structure: Flat
Position: Wave (iv)
Direction: Bottom in wave (iv)
Details:
We observe a potential wave (iv) bottom aligned with the 0.618 Fibonacci retracement level relative to wave (ii). This support appears to have established itself around the $68 level repeatedly.
KO Elliott Wave Technical Analysis – Daily Chart
The analysis suggests that wave (iv) may have reached its bottom, coinciding with the 0.618 Fibonacci retracement level in relation to wave (ii). The price has consistently supported around the $68 mark, indicating that this level could serve as a robust support zone. If this bottom holds, we may see the continuation of the uptrend as wave (v) begins to develop.
TradingLounge KO Stock Elliott Wave Analysis – 1H Chart
The Coca-Cola Company (KO) 1H Chart Analysis
KO Elliott Wave Technical Analysis
Function: Counter Trend
Mode: Corrective
Structure: Flat
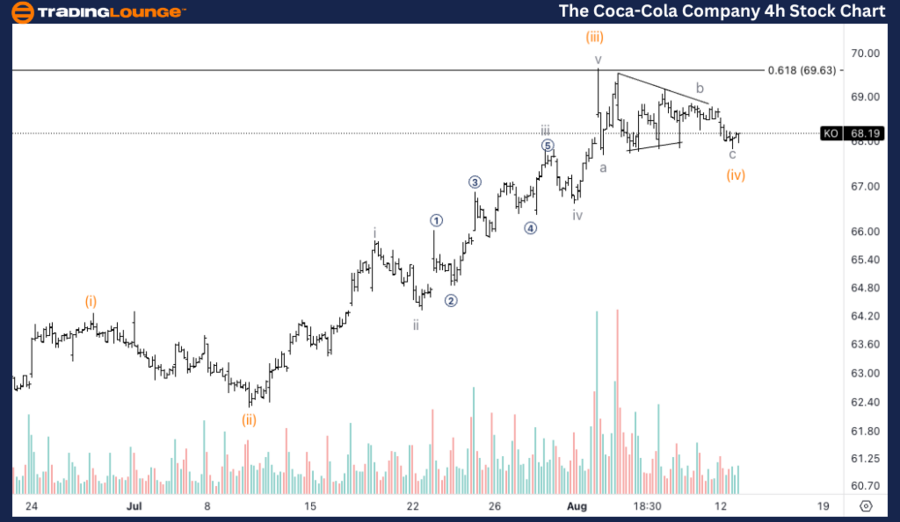
Position: Wave c of (iv)
Direction: Bottom in wave (iv)
Details:
We are observing a potential bottom in wave (iv), highlighted by the formation of a three-wave pattern within the corrective wave. Additionally, the increased volume during the final hours of the previous trading session suggests that a bottom might be near.
KO Stock Technical Analysis – 1H Chart
The 1-hour chart indicates a possible bottom in wave (iv), supported by the presence of a clear three-wave structure within the corrective phase. Furthermore, a significant increase in volume during the last trading hours suggests that a reversal or bottom might be imminent. If this bottom is confirmed, it could signal the onset of the next impulsive wave (v).
Technical Analyst: Alessio Barretta
Source: visit Tradinglounge.com and learn From the Experts Join TradingLounge Here
See Previous: Walmart Inc. (WMT) Elliott Wave Technical Analysis
Special Trial Offer - 0.76 Cents a Day for 3 Months! Click here
Access 7 Analysts Over 170 Markets Covered. Chat Room With Support