Welcome to Our Latest Elliott Wave Analysis for Walmart Inc. (WMT) - August 12, 2024

This Elliott Wave analysis provides a detailed examination of Walmart Inc.'s (WMT) price movements as of August 12, 2024. Utilizing Elliott Wave Theory, this analysis aims to help traders pinpoint potential trading opportunities based on the current market trends and structures. We’ll explore insights from both the daily and 4-hour charts to deliver a thorough understanding of WMT's market behavior.

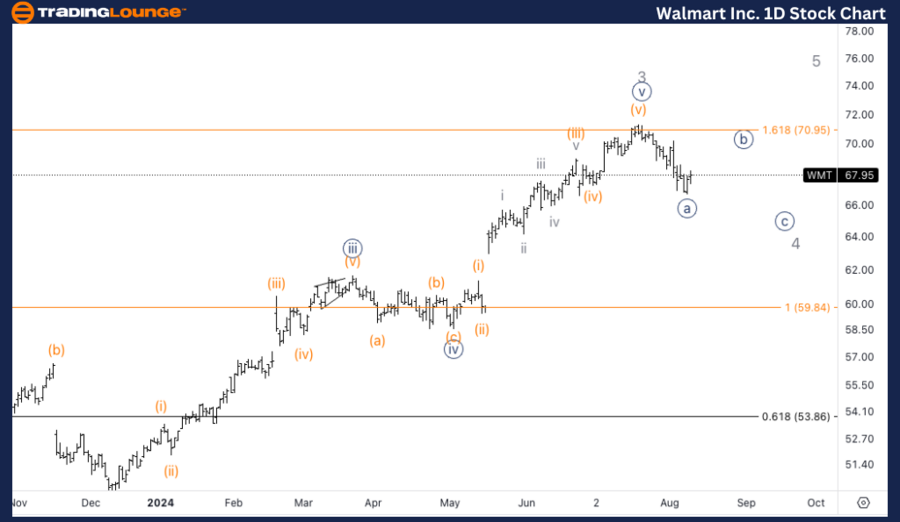
WMT Elliott Wave Analysis - Daily Chart

Walmart Inc. (WMT) Daily Chart Analysis

WMT Elliott Wave Technical Analysis

Function: Counter Trend

Mode: Corrective

Structure: Zigzag

Position: Minor Wave 4

Direction: Downside in Wave 4

Details: After reaching a high of $72, WMT is projected to continue its decline into wave 4. The anticipated downside target for this wave is the Medium Level at approximately $65, where support might be found. Traders should monitor for signs of a bottom forming near this level before considering long positions.

Walmart-Inc-1D-Stock...


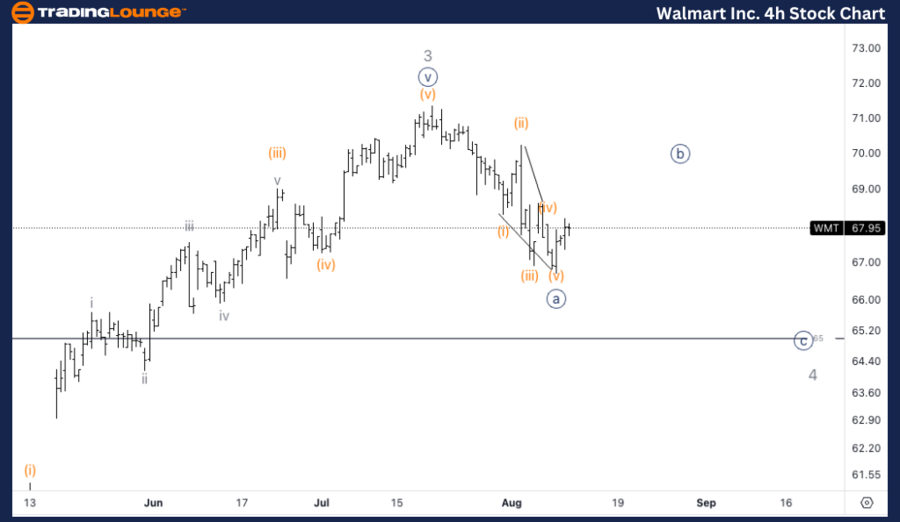
WMT Elliott Wave Analysis - 4H Chart

Walmart Inc. (WMT) 4H Chart Analysis

WMT Elliott Wave Technical Analysis

Function: Counter Trend

Mode: Corrective

Structure: Zigzag

Position: Minute Wave {a}

Direction: Bounce in Wave {b}

Details: WMT appears to have completed wave {a} of the zigzag correction and is expected to experience a bounce in wave {b}. This bounce could ideally reach around $69, corresponding to wave (ii) of the previous diagonal. After this bounce, the price is anticipated to decline further into wave {c}, completing the correction in wave 4.

Technical Analyst: Alessio Barretta

Source: visit Tradinglounge.com and learn From the Experts Join TradingLounge Here 

See Previous: Eli Lilly & Co. (LLY) Elliott Wave Technical Analysis 

Special Trial Offer - 0.76 Cents a Day for 3 Months! Click here

Access 7 Analysts Over 170 Markets Covered. Chat Room With Support

Walmart-Inc-4h-Stock...

Related

Polkadot/U.S. dollar(DOTUSD) Elliott Wave Technical Analysis 23 January 24

Polkadot/U.S. dollar(DOTUSD) Elliott Wave Technical Analysis 23 January 24

Polkadot and U.S. dollar Elliott Wave Technical Analysis dated 23 January 24, DOTUSD Elliott Wave Te...

Read More >
The Walt Disney Company (DIS) Elliott Wave Technical Analysis: Unveiling Market Trends

The Walt Disney Company (DIS) Elliott Wave Technical Analysis: Unveiling Market Trends

Gain valuable insights into The Walt Disney Company's (DIS) market trends with our expert DIS El...

Read More >
Euro/ U.S. Dollar (EURUSD) Elliott Wave Analysis: Daily Orange Wave 5 Impulse & 4‑Hour Gray Wave 2 Correction Signal

Euro/ U.S. Dollar (EURUSD) Elliott Wave Analysis: Daily Orange Wave 5 Impulse & 4‑Hour Gray Wave 2 Correction Signal

Daily chart shows bullish Orange Wave 5 within Navy Blue Wave 1. 4‑hour chart reflects short-term p...

Read More >
TASI Index Elliott Wave Technical Analysis: Detailed look at current market trends

TASI Index Elliott Wave Technical Analysis: Detailed look at current market trends

This analysis of the TASI Index using Elliott Wave theory provides a detailed look at current market...

Read More >
TATA Consumer Product Stock Elliott Wave analysis - Covers the Future Price Targets and TATACONSUM Technical Chart insights

TATA Consumer Product Stock Elliott Wave analysis - Covers the Future Price Targets and TATACONSUM Technical Chart insights

This article provides an in-depth Elliott Wave analysis of TATA Consumer Product stock (TATACONSUM)....

Read More >
Adani Power Elliott Wave Technical Analysis: Stock Forecast, Support & Resistance Levels, and Market Movement Insights

Adani Power Elliott Wave Technical Analysis: Stock Forecast, Support & Resistance Levels, and Market Movement Insights

Elliott Wave analysis of Adani Power stock, covering its price trends, wave counts, and future movem...

Read More >

$1 for 2 Weeks

then $29 a month!

What a Special Offer!

Trade Recommendations

Unleash the power of deversified trading with our comprehensive portfolio, covering 250+ markets:

  • Stock Trades
  • Crypto Trades
  • Forex Trades
  • Commodity Trades
Elliott Wave Analysis

Gain a competitive edge with expert insights and AI-powered Elliott Wave charting into:

  • Global Indices
  • US Stocks & ASX Stocks
  • Forex & Crypto
  • Commodities
Top-Notch Trading Tools

Equip yourself with the tools of success:

  • Real-time Chat rooms
  • Elliott Wave Algorithm
  • Portfolio tools
  • TradingLevels
  • Screener
  • Trading Game
7 Elliott Wave Analysts

Stay ahead of the market with daily charts and insightful videos
Your secret to strategic trading!

JOIN HERE


Welcome to TradingLounge (ASIC A.R.No. 321187), specialists in trades, trading education and technical analysis, covering stocks, indices, commodities, forex and cryptocurrencies.

When you join TradingLounge you have access to everything we offer, including trade tools, educational content and a social platform to chat with like-minded investors.

Read more

@Copyright 2024 by tradinglounge.com

Contact Us

Australian no: 02 4787 6020

International no: +61 (2) 47876020

Pay with:

Find us on