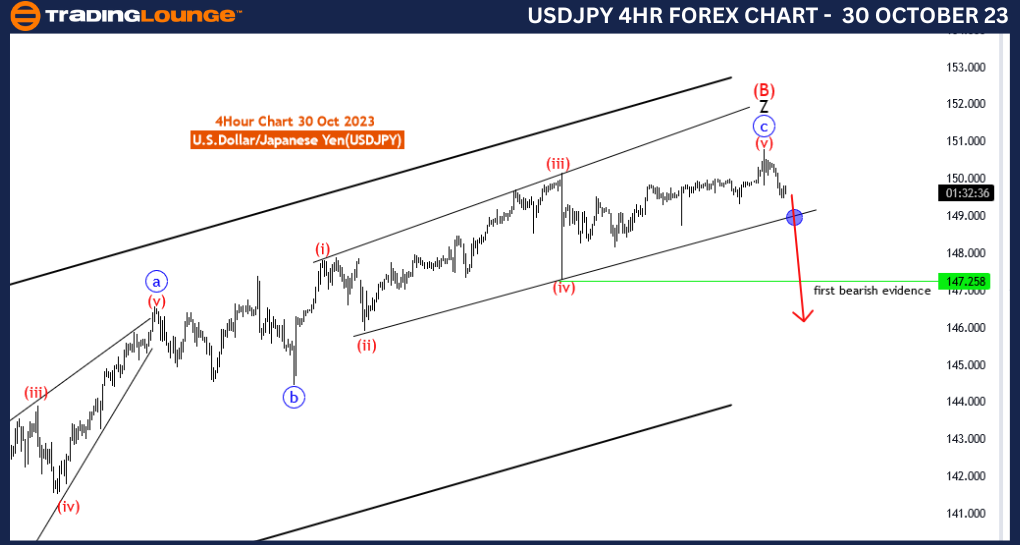
USDJPY Elliott Wave Analysis Trading Lounge 4 Hour Chart, 30 October 23
U.S.Dollar/Japanese Yen (USDJPY) 4 Hour Chart
USDJPY Elliott Wave Technical Analysis
Function: Trend
Mode: impulsive
Structure:subwaves of new trend
Position: new black wave 1
Direction Next lower Degrees:black wave 1 started
Details: red wave 5 of diagonal C looking completed at 150.773 . now looking for a
new down trend . Wave Cancel invalid level: 151.872
The Elliott Wave Analysis for the USD/JPY currency pair, as presented in the "USDJPY Elliott Wave Analysis Trading Lounge 4 Hour Chart" on 30 October 23, provides valuable insights for traders looking to navigate the movements of the U.S. Dollar/Japanese Yen (USD/JPY) on a 4-hour chart. This analysis is crucial for traders seeking to make informed decisions within this specific time frame.
The analysis identifies the market function as "Trend," indicating that the current price movement is aligned with the prevailing market trend. Recognizing the dominant trend direction is essential for traders, as it informs them that the market is in a directional phase, and they should consider this when planning their trading strategies.
The mode is described as "impulsive," which suggests that the market is currently displaying strong and decisive price movements. In Elliott Wave theory, an impulsive move is typically associated with powerful momentum in the direction of the trend. This information can be seen as a green light for traders to explore trading opportunities that align with the existing market trend.
The structure is identified as "sub waves of the new trend," indicating that a new trend may be in the process of forming. Elliott Wave analysis often dissects subwave structures to detect the development of fresh trends or corrections within the broader market context. For traders, this signals the importance of closely monitoring these sub waves for potential trading opportunities that align with the emerging trend.
The analysis specifically mentions that "red wave 5 of diagonal C" is potentially reaching completion around 150.773, with the implication that the diagonal pattern may be nearing its end. Elliott Wave diagonal patterns are significant as they are usually followed by a strong price reversal. This could signal a potential downtrend on the horizon.
Moreover, the text provides a crucial reference point, the "Wave Cancel invalid level: 151.872," which serves as a warning that the described wave structure and the potential downtrend could be invalidated if the price reaches or surpasses this level. For traders, this level is crucial in managing risk and assessing the effectiveness of their trading strategy in changing market conditions.
In summary, the USD/JPY Elliott Wave Analysis for the 4-hour chart on 30 October 23, offers pertinent information for traders. It suggests the possibility of a new downtrend, prompting traders to remain vigilant for trading opportunities aligned with this emerging trend. The provided invalidation level also assists traders in effective risk management, ensuring they can adapt to shifting market dynamics. This information empowers traders with the insights necessary to make informed trading decisions within the 4-hour time frame.
Technical Analyst: Malik Awais
Source: Tradinglounge.com get trial here!

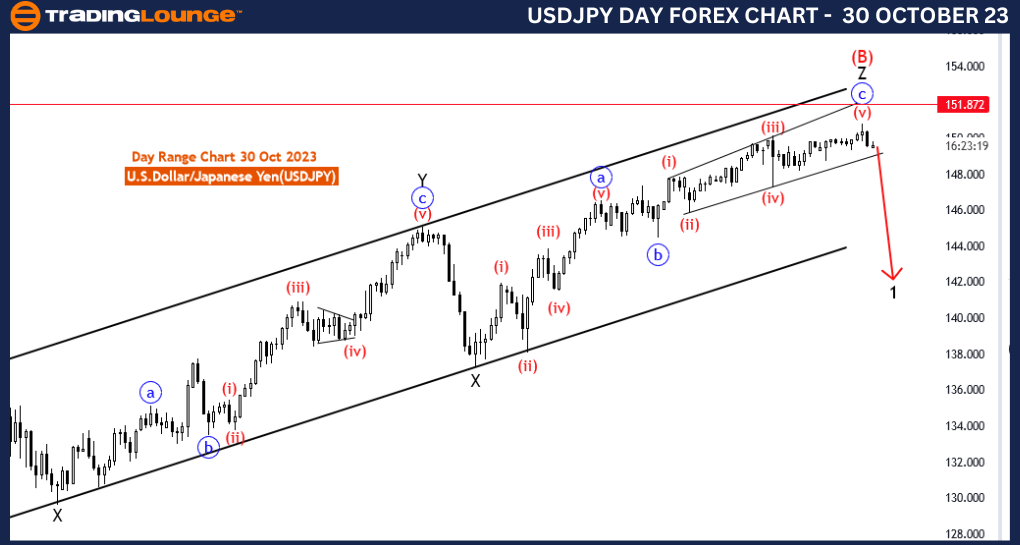
USDJPY Elliott Wave Analysis Trading Lounge Day Chart, 30 October 23
U.S.Dollar/Japanese Yen (USDJPY) Day Chart
USDJPY Elliott Wave Technical Analysis
Function: Trend
Mode: impulsive
Structure:subwaves of new trend
Position: new black wave 1
Direction Next lower Degrees:black wave 1 started
Details: red wave 5 of diagonal C of Z looking completed at 150.773 . now looking for a new down trend. Wave Cancel invalid level: 151.872
The Elliott Wave Analysis for the USD/JPY currency pair, as presented in the "USDJPY Elliott Wave Analysis Trading Lounge Day Chart" on 30 October 23, provides crucial insights for traders seeking to navigate the movements of the U.S. Dollar/Japanese Yen (USD/JPY) on a daily chart. This analysis is of paramount importance for traders looking to make informed decisions within this extended time frame.
The market function is identified as "Trend," indicating that the ongoing price action is in line with the prevailing market trend. Recognizing the dominant trend direction is vital for traders as it signals that the market is currently in a directional phase. This information is invaluable for traders as they plan their strategies.
The mode is characterized as "impulsive," suggesting that the market is exhibiting strong and decisive price movements. In the context of Elliott Wave theory, an impulsive move typically indicates powerful momentum in the direction of the trend. For traders, this serves as a green light to explore trading opportunities that align with the existing market trend.
The structure is defined as "sub waves of the new trend," signifying the potential formation of a new trend. Elliott Wave analysis often dissects subwave structures to detect the emergence of fresh trends or corrections within the broader market context. For traders, this highlights the importance of closely monitoring these sub waves for possible trading opportunities that align with the developing trend.
The analysis specifically mentions that "red wave 5 of diagonal C of Z" is approaching completion around the 150.773 level, with the implication that the diagonal pattern may be concluding. Diagonal patterns in Elliott Wave theory are noteworthy because they are typically followed by a significant price reversal. This suggests the likelihood of an impending downtrend.
Furthermore, the analysis provides a crucial reference point: the "Wave Cancel invalid level: 151.872." This level serves as a warning that the described wave structure and the potential downtrend could be invalidated if the price reaches or exceeds this level. For traders, this level is pivotal for risk management and evaluating the effectiveness of their trading strategy in response to changing market dynamics.
In summary, the USD/JPY Elliott Wave Analysis for the daily chart on 30 October 23, furnishes significant information for traders. It hints at the possibility of a new downtrend, prompting traders to remain vigilant for trading opportunities aligned with this emerging trend. The provided invalidation level is a critical tool for traders, enabling effective risk management and facilitating adaptation to evolving market conditions. This information equips traders with the insights needed to make informed trading decisions within the daily time frame.
Technical Analyst: Malik Awais
Source: Tradinglounge.com get trial here!
