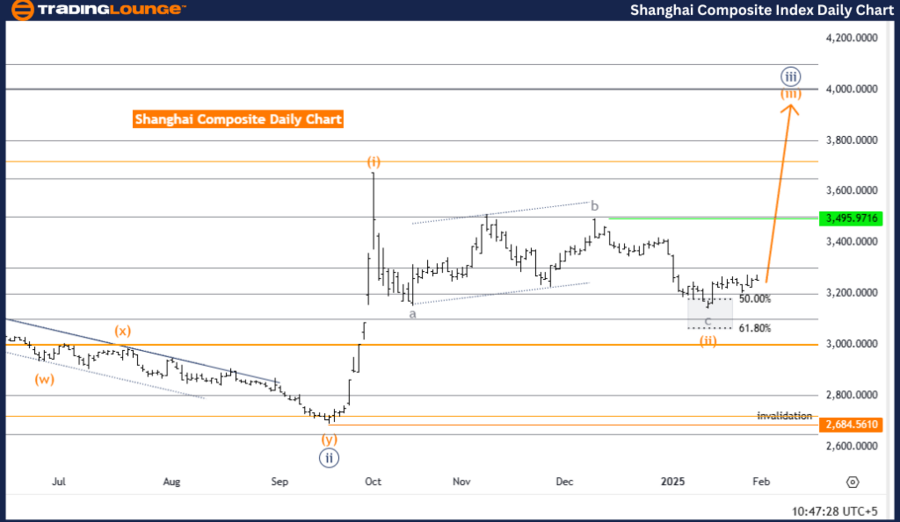
Shanghai Composite Elliott Wave Analysis – Trading Lounge Day Chart
Shanghai Composite Index Day Chart
Shanghai Composite Elliott Wave Technical Analysis
- Function: Bullish Trend
- Mode: Impulsive
- Structure: Orange Wave 3
- Position: Navy Blue Wave 3
- Direction Next Higher Degrees: Orange Wave 3 (Started)
Details:
-
Orange Wave 2 appears to have concluded, signaling the initiation of Orange Wave 3.
-
Wave Cancel Invalidation Level: 2684.5610
The Shanghai Composite Daily Chart analysis, based on Elliott Wave Theory, confirms a bullish trend with an impulsive wave structure. The focus remains on Orange Wave 3, which has started after the completion of Orange Wave 2, indicating sustained upward momentum.
Currently, the market is positioned in Navy Blue Wave 3, which represents the mid-phase of the ongoing bullish sequence. The completion of Orange Wave 2 provides strong technical confirmation that Orange Wave 3 will likely experience significant price expansion, often marked by increased trading activity.
As Orange Wave 3 progresses, price movements are expected to trend higher, reflecting strong bullish sentiment in the market. This wave typically represents one of the strongest upward movements in the Elliott Wave cycle.
The wave cancel invalidation level is set at 2684.5610. A decline below this threshold would invalidate the current wave structure, requiring a fresh evaluation of the market outlook.
Summary
The Shanghai Composite Daily Chart analysis indicates a strong bullish trend, with Orange Wave 3 actively advancing within Navy Blue Wave 3. The conclusion of Orange Wave 2 confirms the potential for further upward momentum.
Traders and investors should monitor price action closely, using the invalidation level as a reference for confirming or adjusting market strategies. This analysis provides valuable insights into the market’s bullish trend and expected price dynamics.
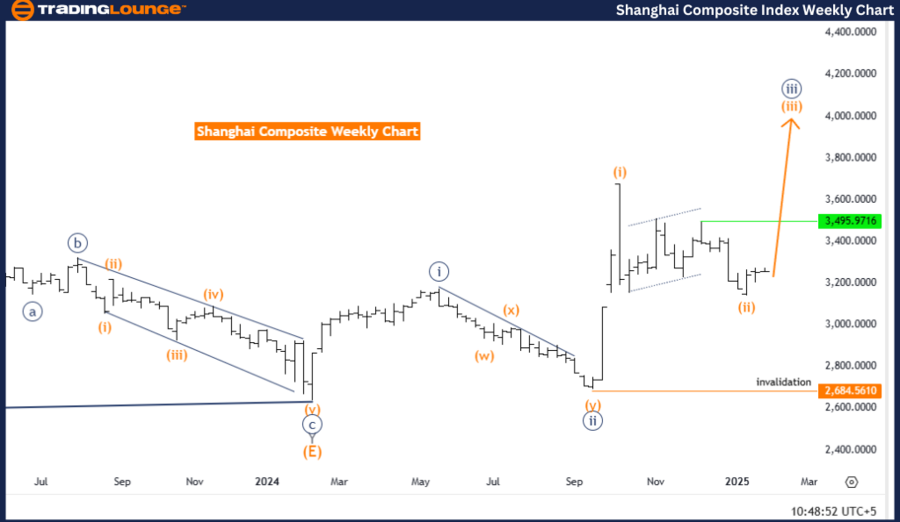
Shanghai Composite Elliott Wave Analysis – Trading Lounge Weekly Chart
Shanghai Composite Elliott Wave Technical Analysis
- Function: Bullish Trend
- Mode: Impulsive
- Structure: Orange Wave 3
- Position: Navy Blue Wave 3
- Direction Next Higher Degrees: Orange Wave 3 (Started)
Details:
-
Orange Wave 2 has likely concluded, paving the way for Orange Wave 3.
-
Wave Cancel Invalidation Level: 2684.5610
The Shanghai Composite Weekly Chart analysis, following Elliott Wave Theory, confirms an impulsive bullish trend. The initiation of Orange Wave 3 post-Orange Wave 2 completion suggests continuation of the current bullish cycle.
At present, the market is advancing within Navy Blue Wave 3, a pivotal stage in this Elliott Wave sequence. This positioning indicates strong bullish momentum, which typically defines a powerful price expansion phase. With Orange Wave 3 now in motion, traders can expect higher price acceleration, often accompanied by greater trading volume.
The ongoing development of Orange Wave 3 suggests further gains, reinforcing expectations for a strong upward trajectory. The recent completion of a corrective phase (Orange Wave 2) has cleared the path for bullish market conditions, signaling higher price levels in the near term.
The wave cancel invalidation level remains at 2684.5610. A price decline below this mark would invalidate the current wave count, requiring a fresh market outlook assessment.
Summary
The Shanghai Composite Weekly Chart analysis confirms a bullish trend, with Orange Wave 3 actively progressing within Navy Blue Wave 3. The end of Orange Wave 2 provides a strong technical foundation for further market gains.
Investors and traders should track price developments closely, using the invalidation level as a key benchmark for adjusting strategies. This analysis delivers key insights into the bullish market structure and projected price action.
Technical Analyst: Malik Awais
Source: visit Tradinglounge.com and learn From the Experts Join TradingLounge Here
Previous: Dow Jones Elliott Wave Technical Analysis
VALUE Offer - Buy 1 Month & Get 3 Months!Click here
Access 7 Analysts Over 200 Markets Covered. Chat Room With Support