Coffee Elliott Wave Technical Analysis

Since reaching its peak in September 2011, coffee prices have experienced a significant retreat from the highs observed in mid-September 2024. The market seems to have completed a corrective technical structure, signaling the potential for further decline before continuing its long-term bullish trend.

Long-Term Chart Analysis

Historically, coffee prices have fluctuated within a wide range, with key support levels found between $40 and $55, while resistance levels extend from $276 to $337. The current bullish cycle began in May 2019, marking the start of a strong upward movement. This cycle’s first phase peaked in February 2022, representing a period of significant highs. The corrective second phase concluded with a bottom in January 2023. From this point, the market entered the third and ongoing phase of the bullish cycle, which is evolving within a larger corrective pattern under the broader Elliott Wave framework.

The third phase of this rally appears to be unfolding as a corrective wave within the broader impulse that started in 2019. Although the recent price action suggests further gains in the future, a major pullback seems likely before the uptrend continues.

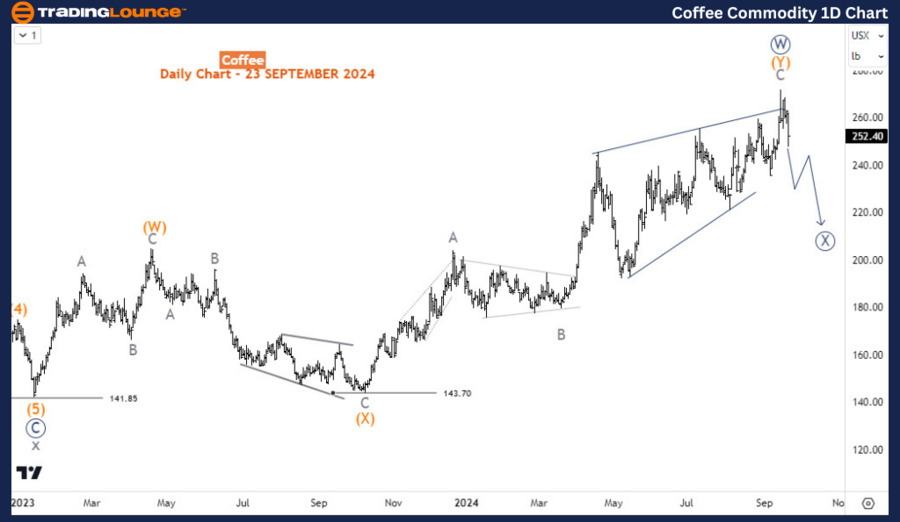
Coffee Commodity Daily Chart Analysis

On the daily chart, the third phase of recovery completed its first leg, labeled wave (W), in April 2023. This was followed by a three-wave corrective structure, wave (X), which found support at 143.70 in October 2023. The following rally corresponds to wave (Y) of the primary degree wave W (circled), marking the completion of this bullish phase.

Wave (Y) of W (circled) seems to have formed an ending diagonal structure, which indicates that the uptrend is losing momentum. If this structure has completed, a corrective pullback in wave X (circled) is anticipated. This correction could manifest as a double zigzag, a complex pattern that typically results in further downside before the primary uptrend resumes.

Coffee-Commodity-1D-...


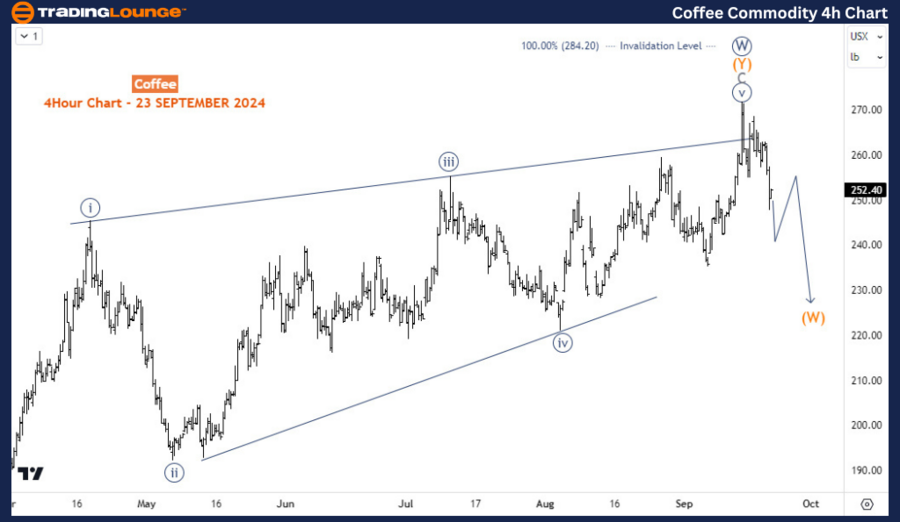
Coffee Commodity H4 Chart Analysis

On the H4 chart, the completion of wave (Y) of W (circled) is confirmed by the identification of an ending diagonal structure. Therefore, a corrective dip for wave X (circled) is expected to follow. The recent decline since mid-September 2024 suggests that prices are still within the wave (W) of X (circled), supporting a bearish outlook in the short to medium term. Despite this, the long-term outlook remains bullish, with coffee prices likely to resume their upward trajectory after the anticipated correction.

Technical Analyst: Sanmi Adeagbo

Source: visit Tradinglounge.com and learn From the Experts Join TradingLounge Here 

See Previous: Soybean Elliott Wave Technical Analysis

VALUE Offer - Buy 1 Month & Get 3 Months!Click here

Access 7 Analysts Over 200 Markets Covered. Chat Room With Support

Coffee-Commodity-4h-...

Related

CSX Corp. (CSX) U.S. Stocks Elliott Wave Technical Daily & 1‑Hour Analysis: Wave 3 Bullish, $33 Top, $30 Retracement Setup

CSX Corp. (CSX) U.S. Stocks Elliott Wave Technical Daily & 1‑Hour Analysis: Wave 3 Bullish, $33 Top, $30 Retracement Setup

This CSX Elliott Wave analysis covers both daily and 1‑hour charts. On the daily timeframe, CSX is ...

Read More >
Australian Dollar/U.S.Dollar (AUDUSD) Forex Elliott Wave Technical Analysis: In-depth Trading Lounge Chart Overview

Australian Dollar/U.S.Dollar (AUDUSD) Forex Elliott Wave Technical Analysis: In-depth Trading Lounge Chart Overview

This article provides an in-depth Elliott Wave analysis of the AUDUSD pair, featuring key insights i...

Read More >
Microsoft Inc. (MSFT) Elliott Wave Analysis: Stock Forecast, Price Prediction & Market Trends for Bullish or Bearish Reversal

Microsoft Inc. (MSFT) Elliott Wave Analysis: Stock Forecast, Price Prediction & Market Trends for Bullish or Bearish Reversal

MSFT Elliott Wave analysis examines Microsoft stock's trend using Elliott Wave Theory to identif...

Read More >
Maximizing Profits: Procter & Gamble (PG) Elliott Wave Technical Analysis Unveils Lucrative Trends

Maximizing Profits: Procter & Gamble (PG) Elliott Wave Technical Analysis Unveils Lucrative Trends

Explore the latest Elliott Wave analysis for The Procter & Gamble Company (PG). Delve into comprehen...

Read More >
Technical Analysis of GX Uranium: GX Uranium Commodity Elliott Wave Analysis

Technical Analysis of GX Uranium: GX Uranium Commodity Elliott Wave Analysis

In an ever-evolving uranium market, the GX Uranium ETF (URA) stands out as a pivotal investment oppo...

Read More >
The Walt Disney Company (DIS) Stock - Elliottwave Technical Analysis

The Walt Disney Company (DIS) Stock - Elliottwave Technical Analysis

This comprehensive analysis provides an expert overview of The Walt Disney Company (DIS) stock, util...

Read More >

$1 for 2 Weeks

then $29 a month!

What a Special Offer!

Trade Recommendations

Unleash the power of deversified trading with our comprehensive portfolio, covering 250+ markets:

  • Stock Trades
  • Crypto Trades
  • Forex Trades
  • Commodity Trades
Elliott Wave Analysis

Gain a competitive edge with expert insights and AI-powered Elliott Wave charting into:

  • Global Indices
  • US Stocks & ASX Stocks
  • Forex & Crypto
  • Commodities
Top-Notch Trading Tools

Equip yourself with the tools of success:

  • Real-time Chat rooms
  • Elliott Wave Algorithm
  • Portfolio tools
  • TradingLevels
  • Screener
  • Trading Game
7 Elliott Wave Analysts

Stay ahead of the market with daily charts and insightful videos
Your secret to strategic trading!

JOIN HERE


Welcome to TradingLounge (ASIC A.R.No. 321187), specialists in trades, trading education and technical analysis, covering stocks, indices, commodities, forex and cryptocurrencies.

When you join TradingLounge you have access to everything we offer, including trade tools, educational content and a social platform to chat with like-minded investors.

Read more

@Copyright 2024 by tradinglounge.com

Contact Us

Australian no: 02 4787 6020

International no: +61 (2) 47876020

Pay with:

Find us on