Soybean Elliott Wave Technical Analysis

The soybean market is currently in a retracement phase within a long-term corrective pattern that has been unfolding since the peak in June 2022. Although short-term upward momentum is anticipated, the overall trend suggests that a significant sell-off could resume, potentially pushing prices toward the lows observed in 2020.

Long-Term Perspective

Before the downturn in June 2022, the soybean market experienced a strong bullish impulse wave starting in May 2019, lifting prices from around $806 to notable highs. However, over the past 26 months, the market has retraced more than two-thirds of those gains. From an Elliott Wave analysis perspective, the ongoing corrective phase is displaying a three-wave structure, which is common in complex corrective patterns and indicates a deep retracement.

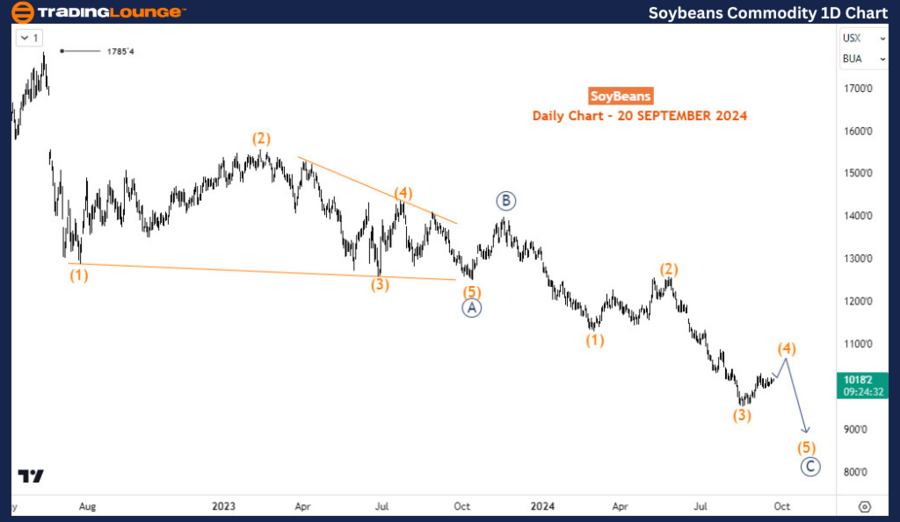
Soybean Daily Chart Analysis

On the daily chart, this corrective wave is developing at the primary wave level. Wave A concluded at $1,249 in October 2023, followed by a peak in Wave B at $1,398 in November 2023. Currently, Wave C is unfolding to the downside. Within this Wave C, sub-waves (1), (2), and (3) of 5 have already been completed. The market is now experiencing a retracement in Wave (4), which is trading above the key $1,000 level. The critical question now is: how high can this Wave (4) rally extend?

Soybean-Commodity-1D...


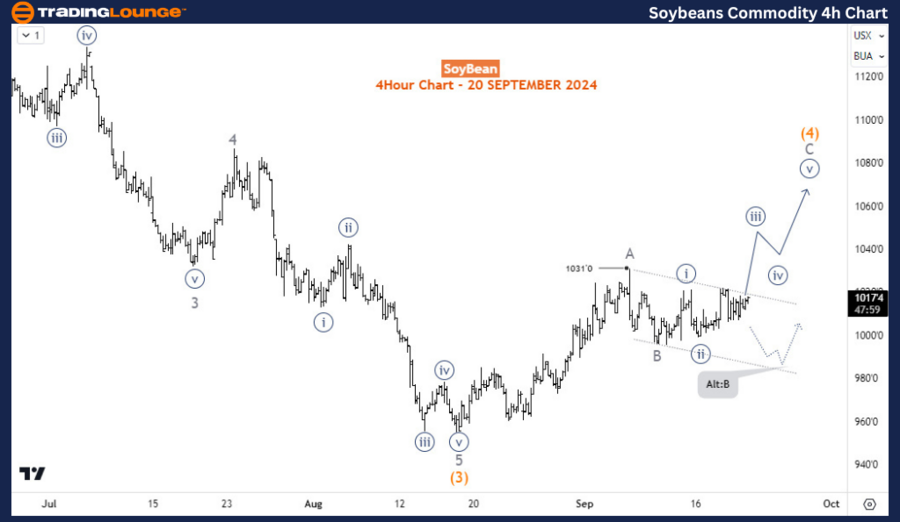
Soybean 4-Hour Chart Analysis

Looking closer at the H4 chart, Wave (4) has completed its first sub-wave, known as Wave A. The bullish move observed since September 11, 2024, suggests that Wave B may be complete. To confirm that Wave B has ended and the market is entering Wave C, the price must break above the high of Wave A. If this scenario plays out, Wave C could extend toward the $1,070 level. On the other hand, if the price fails to break above Wave A’s high, it may indicate that Wave B will extend further down, potentially dipping below $1,000 before forming a solid support level and initiating Wave C.

Technical Analyst: Sanmi Adeagbo

Source: visit Tradinglounge.com and learn From the Experts Join TradingLounge Here 

See Previous: Corn Elliott Wave Technical Analysis

VALUE Offer - Buy 1 Month & Get 3 Months!Click here

Access 7 Analysts Over 200 Markets Covered. Chat Room With Support

Soybean-Commodity-4H...

Related

WiseTech Global Limited Stock Analysis: WTC Elliott Wave Technical analysis & ASX Market Trading Strategy

WiseTech Global Limited Stock Analysis: WTC Elliott Wave Technical analysis & ASX Market Trading Strategy

"Explore in-depth Elliott Wave analysis and technical insights for WiseTech Global Limited (WTC...

Read More >
Gain valuable insights XRP Crypto Price News Today XRPUSD Elliott Wave Technical Analysis

Gain valuable insights XRP Crypto Price News Today XRPUSD Elliott Wave Technical Analysis

Gain valuable insights into XRPUSD's market dynamics with technical analysis, Elliott Wave predi...

Read More >
Gold Market Analysis: Gold (XAUUSD) Commodity Elliott Wave Technical Analysis and Optimal Entry Points for Long Positions

Gold Market Analysis: Gold (XAUUSD) Commodity Elliott Wave Technical Analysis and Optimal Entry Points for Long Positions

This article provides a detailed Elliott Wave technical analysis of gold, focusing on the bullish tr...

Read More >
U.S. Dollar / Canadian Dollar Elliott Wave Technical Analysis: Navigate the Current Market Structure of USDCAD Effectively

U.S. Dollar / Canadian Dollar Elliott Wave Technical Analysis: Navigate the Current Market Structure of USDCAD Effectively

This article provides an in-depth Elliott Wave analysis of the USDCAD currency pair. With insights o...

Read More >
NEOUSD Elliott Wave Technical  Analysis: Latest Price Prediction, WXY Correction Pattern, and Market Trend Insights

NEOUSD Elliott Wave Technical Analysis: Latest Price Prediction, WXY Correction Pattern, and Market Trend Insights

NEOUSD is currently experiencing a corrective counter-trend movement, forming a zigzag (WXY) pattern...

Read More >

$1 for 2 Weeks

then $29 a month!

What a Special Offer!

Trade Recommendations

Unleash the power of deversified trading with our comprehensive portfolio, covering 250+ markets:

  • Stock Trades
  • Crypto Trades
  • Forex Trades
  • Commodity Trades
Elliott Wave Analysis

Gain a competitive edge with expert insights and AI-powered Elliott Wave charting into:

  • Global Indices
  • US Stocks & ASX Stocks
  • Forex & Crypto
  • Commodities
Top-Notch Trading Tools

Equip yourself with the tools of success:

  • Real-time Chat rooms
  • Elliott Wave Algorithm
  • Portfolio tools
  • TradingLevels
  • Screener
  • Trading Game
7 Elliott Wave Analysts

Stay ahead of the market with daily charts and insightful videos
Your secret to strategic trading!

JOIN HERE


Welcome to TradingLounge (ASIC A.R.No. 321187), specialists in trades, trading education and technical analysis, covering stocks, indices, commodities, forex and cryptocurrencies.

When you join TradingLounge you have access to everything we offer, including trade tools, educational content and a social platform to chat with like-minded investors.

Read more

@Copyright 2024 by tradinglounge.com

Contact Us

Australian no: 02 4787 6020

International no: +61 (2) 47876020

Pay with:

Find us on