Wheat Market Trends: A Comprehensive Elliott Wave Analysis

Wheat Elliott wave Technical analysis

Function: Trend

Mode: Trend

Structure: Diagonal (D1)

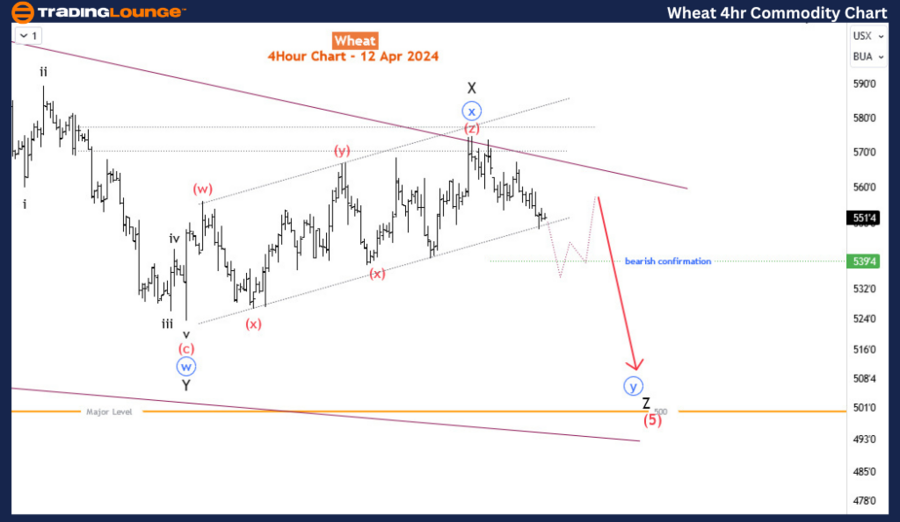
Position: Blue wave 'x'

Direction: Downward for blue wave 'y' of Y of (5)

Details: Post completion of the triple three for wave X, the market is gearing towards a downturn to commence the sub-waves of wave Z. A bearish trend is confirmed below the 540 mark.

During the period from March 11th to April 8th, 2024, the wheat market experienced an upward movement, recording gains of over 9%. Despite this positive movement, it served as a corrective phase, indicating an impending return to a bearish trend that began in March 2022. The rally faced resistance in the critical range of 570-577, after completing a triple zigzag correction pattern. Currently, the market shows scant resistance, setting the stage for a potential decline towards the key 500 level.

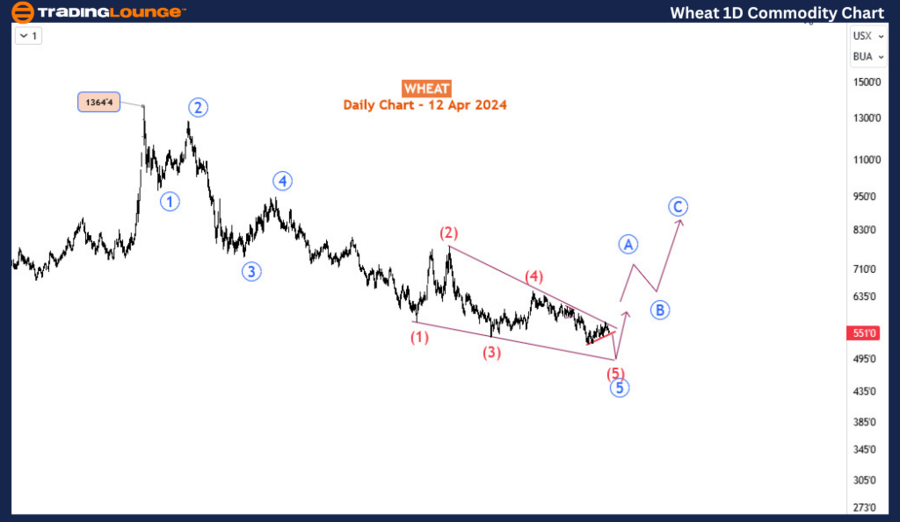
Wheat Day Chart Analysis

On the daily chart, a bearish impulse wave has been active since March 2022, nearing its conclusion. This phase is expected to lead to a significant bullish correction, with wave (5) of a higher degree, marked as blue '5', gearing up to take place. Notably, wave '5' (in blue) is concluding an ending diagonal, or wedge pattern, a strong reversal signal in technical analysis. Moreover, wave (5) is in its latter stages, having completed a triple zigzag pattern, as visible on the H4 chart.

Wheat-1D-commodity-c...


TradingLounge Commodities Elliott Wave Analysis of Wheat

Wheat 4-Hour Chart Analysis

Focusing on the H4 chart, wave X of (5) ended with a triple zigzag, facing resistance in the 570-577 zone as previously noted. A move below the lower limit of wave X would signify the start of wave Z, which is likely to split into a zigzag (simple, double, or triple) and fall towards the 500 mark.

To summarize, the wheat market is nearing the end of the bearish impulse phase that started in March 2022. While a corrective upswing is imminent, there's room for further decline towards 500 before a substantial bullish correction takes place. Traders are advised to stay alert and keep an eye on crucial levels to adeptly manoeuvre through the shifting market dynamics.

Technical Analyst: Sanmi Adeagbo

Source: visit Tradinglounge.com and learn From the Experts Join TradingLounge Here 

See Previous: Gold Commodity

TradingLounge Once Off SPECIAL DEAL: Here > 1 month Get 3 months

TradingLounge's Free Week Extravaganza!

April 14 – 21: Unlock the Doors to Trading Excellence — Absolutely FREE

Wheat-4hr-commodity-...

Related

BANKS, AAPL, AMZN, NVDA, TSLA, GOOGL, META, NFLX, MSFT. Elliott Wave Insights & Strategies

BANKS, AAPL, AMZN, NVDA, TSLA, GOOGL, META, NFLX, MSFT. Elliott Wave Insights & Strategies

Nvidia and Meta Platforms will top in Primary Wave 1) in March 2024. They have a good few months for...

Read More >
The Walt Disney Company (DIS) Elliott Wave Technical Analysis: Unveiling Market Trends

The Walt Disney Company (DIS) Elliott Wave Technical Analysis: Unveiling Market Trends

Gain valuable insights into The Walt Disney Company's (DIS) market trends with our expert DIS El...

Read More >
Insightful Day and 4-Hour Chart Review: British Pound/Japanese Yen(GBPJPY) Forex Elliott Wave Technical Analysis

Insightful Day and 4-Hour Chart Review: British Pound/Japanese Yen(GBPJPY) Forex Elliott Wave Technical Analysis

This comprehensive guide offers detailed GBPJPY trading analysis, focusing on Elliott Wave forecasts...

Read More >
Spotify Technology Stock Forecast: SPOT Elliott Wave Technical Analysis Predicts Bullish Trend Continuation with Resistance Target

Spotify Technology Stock Forecast: SPOT Elliott Wave Technical Analysis Predicts Bullish Trend Continuation with Resistance Target

Spotify (SPOT) is in a strong uptrend with wave 5 unfolding. Expect bullish continuation with short-...

Read More >
CAC 40 Elliott Wave Forecast Shows Bullish Trend and Trading Opportunities in France Stock Market on Daily and Weekly Charts

CAC 40 Elliott Wave Forecast Shows Bullish Trend and Trading Opportunities in France Stock Market on Daily and Weekly Charts

Explore bullish Elliott Wave setups on the CAC 40 with actionable insights on trend direction, wave ...

Read More >
Australian Dollar/U.S. Dollar Forex Pair: In-Depth AUDUSD Elliott Wave Technical Analysis and Trading Strategies

Australian Dollar/U.S. Dollar Forex Pair: In-Depth AUDUSD Elliott Wave Technical Analysis and Trading Strategies

This article provides an in-depth analysis of AUDUSD using the Elliott Wave theory, covering both da...

Read More >

Buy 1 Month

Get 3 Months!

Special Offer:

Trade Recommendations

Unleash the power of deversified trading with our comprehensive portfolio, covering:

  • Stock Trades
  • Crypto Trades
  • Forex Trades
  • Commodity Trades
Elliott Wave Analysis

Gain a competive edge with expert insights in to:

  • Global Indices
  • US Stocks & ASX Stocks
  • Forex & Crypto
  • Commodities
Top-Notch Trading Tools

Equip yourself with the tools of success:

  • Social Chat
  • Elliott Wave Algorithm
  • Screener
  • TradingLevels
  • Trading Game
7 Elliott Wave Analysts

Stay ahead of the market with daily charts and insightful videos
-Your secret to strategic trading!

JOIN HERE


Welcome to TradingLounge (ASIC A.R.No. 321187), specialists in trades, trading education and technical analysis, covering stocks, indices, commodities, forex and cryptocurrencies.

When you join TradingLounge you have access to everything we offer, including trade tools, educational content and a social platform to chat with like-minded investors.

Read more

@Copyright 2024 by tradinglounge.com

Contact Us

Australian no: 02 4787 6020

International no: +61 (2) 47876020

Pay with:

Find us on