WIPRO – WIPRO Elliott Wave Analysis TradingLounge (1D Chart)

WIPRO Elliott Wave Technical Analysis

Function: Larger Degree Trend Higher (Intermediate degree, orange).

Mode: Motive.

Structure: Impulse.

Position: Minute Wave ((iii)) Navy.

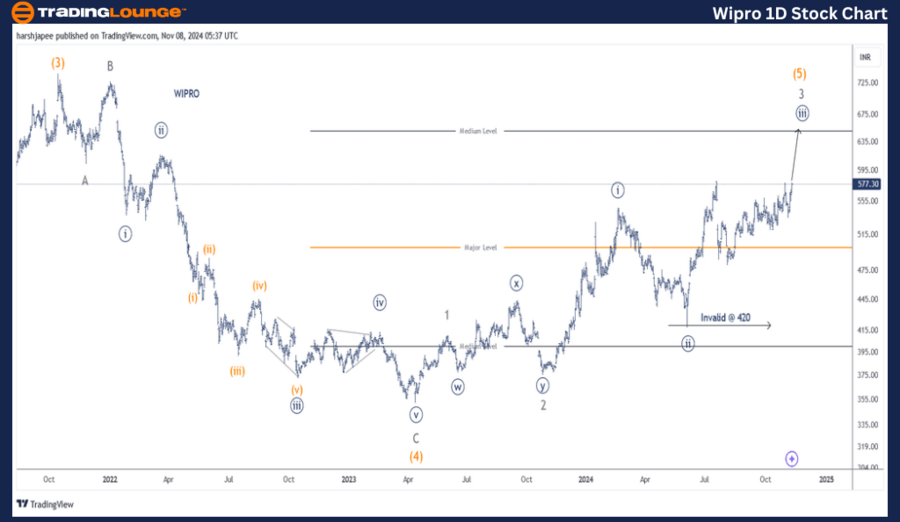
Details: Minute Wave ((iii)) Navy is advancing within Minor Wave 3 Grey of Intermediate Wave (5) Orange against the invalidation point at 420.

Key Highlights:

  • Invalidation Point: 420.

WIPRO Daily Chart Technical Analysis and Potential Elliott Wave Counts

The WIPRO daily chart suggests a continued bullish rally as Minor Wave 3 of Intermediate Wave (5) progresses beyond the 420 low. The chart signals strong upward momentum, with bulls firmly in control as Minute Wave ((iii)) Navy potentially extends.

  • Intermediate Wave (3) concluded near the 780 level in October 2021.
  • A corrective zigzag (Intermediate Wave (4)) followed, reaching the 350 zone by April 2023.
  • Bulls regained control from this point, leading to the development of Intermediate Wave (5).

Minor Wave 1 Grey, within Intermediate Wave (5), completed as an impulse, followed by a combination that ended Minor Wave 2 Grey near 375. Now, Minor Wave 3 is advancing, indicating further upside.

WIPRO-1D-Stock-Chart...


WIPRO – WIPRO (4H Chart) Elliott Wave Technical Analysis

WIPRO Stock Technical Analysis

Function: Larger Degree Trend Higher (Intermediate degree, orange).

Mode: Motive.

Structure: Impulse.

Position: Minute Wave ((iii)) Navy.

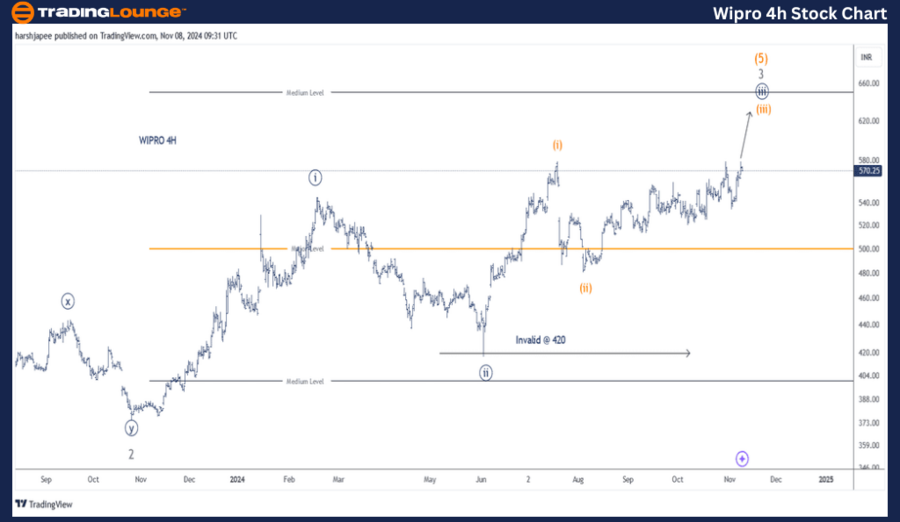
Details: Minute Wave ((iii)) Navy is progressing higher within Minor Wave 3 Grey of Intermediate Wave (5) Orange. Additionally, Minuette Waves (i) and (ii) Orange may already be in place, with Minuette Wave (iii) currently advancing.

Key Highlights:

  • Invalidation Point: 420.

WIPRO 4H Chart Technical Analysis and Potential Elliott Wave Counts

The WIPRO 4H chart provides insights into the sub-waves following the completion of Minor Wave 2 Grey near the 380 mark in October 2023.

  • Minute Wave ((i)) extended into the 545-550 range.
  • Minute Wave ((ii)) concluded around 420.
  • Minute Wave ((iii)) is now in progress, suggesting a potential extension above 420.

Technical Analyst: Harsh Japee

Source: visit Tradinglounge.com and learn From the Experts Join TradingLounge Here 

Previous: BHARAT ELECTRONICS Elliott Wave Technical Analysis

VALUE Offer - Buy 1 Month & Get 3 Months!Click here

Access 7 Analysts Over 200 Markets Covered. Chat Room With Support

WIPRO-4h-Stock-Chart...


Conclusion

WIPRO is trending higher within Minute Wave ((iii)) of Minor Wave 3 of Intermediate Wave (5) Orange, maintaining the 420 level as a key support and invalidation point. The current progression signals sustained bullish momentum, with further upside expected as the waves unfold.

Related

Insurance Australia Group (IAG) Stock Elliott Wave Forecast Suggests Bearish Move With Key Resistance Based on ASX Analysis

Insurance Australia Group (IAG) Stock Elliott Wave Forecast Suggests Bearish Move With Key Resistance Based on ASX Analysis

Technical analysis of IAG using Elliott Wave theory signals a potential bearish move toward 7.79, wi...

Read More >
NASDAQ Elliott Wave Analysis: Stock Market Trends, Impulse Wave Forecast, Trading Strategies, and Key Resistance & Support Levels

NASDAQ Elliott Wave Analysis: Stock Market Trends, Impulse Wave Forecast, Trading Strategies, and Key Resistance & Support Levels

NASDAQ Elliott Wave Analysis, covering technical indicators, price movements, and market trends. Lea...

Read More >
Euro/U.S. Dollar (EURUSD) Elliott Wave Analysis: Forex Market Trends, Price Action Predictions, and Trading Strategy Insights

Euro/U.S. Dollar (EURUSD) Elliott Wave Analysis: Forex Market Trends, Price Action Predictions, and Trading Strategy Insights

This EUR/USD Elliott Wave Analysis provides a detailed technical outlook on the Forex market trend, ...

Read More >
Promising trends according to Ethereum/ U.S. dollar(ETHUSD) Elliott Wave Technical Analysis

Promising trends according to Ethereum/ U.S. dollar(ETHUSD) Elliott Wave Technical Analysis

Ethereum's performance against the U.S. dollar (ETHUSD) is analyzed through Elliott Wave analysi...

Read More >
The TJX Companies Inc. Elliott Wave Technical Analysis for TJX Stock Shows Price Target at $130, and Strong Upside Momentum Ahead

The TJX Companies Inc. Elliott Wave Technical Analysis for TJX Stock Shows Price Target at $130, and Strong Upside Momentum Ahead

This technical overview of The TJX Companies Inc. (NYSE: TJX) uses Elliott Wave theory to analyze bu...

Read More >

$1 for 2 Weeks

then $29 a month!

What a Special Offer!

Trade Recommendations

Unleash the power of deversified trading with our comprehensive portfolio, covering 250+ markets:

  • Stock Trades
  • Crypto Trades
  • Forex Trades
  • Commodity Trades
Elliott Wave Analysis

Gain a competitive edge with expert insights and AI-powered Elliott Wave charting into:

  • Global Indices
  • US Stocks & ASX Stocks
  • Forex & Crypto
  • Commodities
Top-Notch Trading Tools

Equip yourself with the tools of success:

  • Real-time Chat rooms
  • Elliott Wave Algorithm
  • Portfolio tools
  • TradingLevels
  • Screener
  • Trading Game
7 Elliott Wave Analysts

Stay ahead of the market with daily charts and insightful videos
Your secret to strategic trading!

JOIN HERE


Welcome to TradingLounge (ASIC A.R.No. 321187), specialists in trades, trading education and technical analysis, covering stocks, indices, commodities, forex and cryptocurrencies.

When you join TradingLounge you have access to everything we offer, including trade tools, educational content and a social platform to chat with like-minded investors.

Read more

@Copyright 2024 by tradinglounge.com

Contact Us

Australian no: 02 4787 6020

International no: +61 (2) 47876020

Pay with:

Find us on