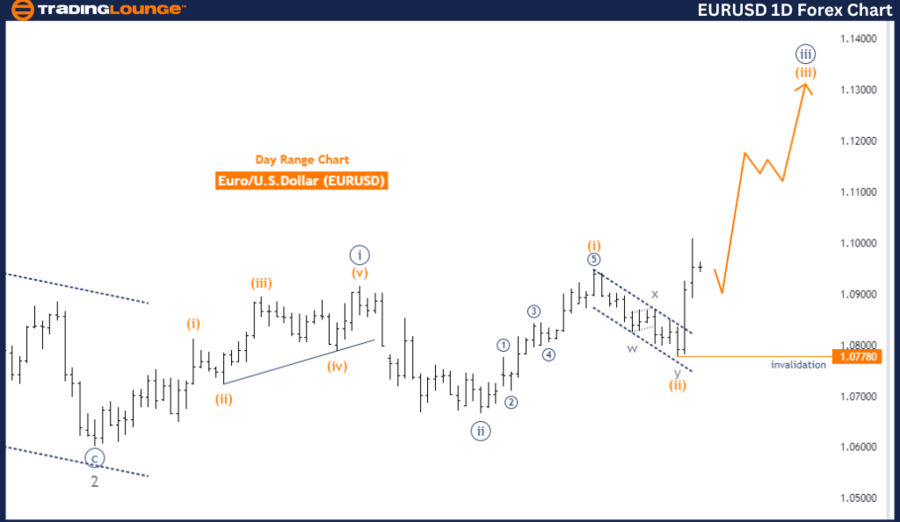
EURUSD Elliott Wave Analysis Trading Lounge Day Chart
Euro/ U.S. Dollar (EURUSD) Day Chart
EURUSD Elliott Wave Technical Analysis
Function: Trend
Mode: Impulsive
Structure: Orange wave 3
Position: Navy blue wave 3
Direction Next Lower Degrees: Orange wave 4
Details: Orange wave 2 looking completed, now orange wave 3 is in play. Wave cancel invalid level: 1.07780
The EURUSD Elliott Wave Analysis for the daily chart shows a trending market in impulsive mode. The primary wave structure identified is orange wave 3, indicating a strong trend continuation. Currently, the market is in navy blue wave 3 within this impulsive structure, suggesting increasing momentum.
The analysis specifies that orange wave 2 appears to be completed, indicating the corrective phase has ended and the market is advancing in orange wave 3. The completion of orange wave 2 typically signals the start of a significant upward move, as wave 3 in Elliott Wave theory is often the most powerful and extended wave in the impulsive sequence.
Navy blue wave 3 is the current position within this structure, indicating a robust upward trend. This wave is part of the larger orange wave 3, highlighting a multi-degree alignment of bullish momentum. As the market progresses through navy blue wave 3, the next phase to watch for would be the development of orange wave 4, representing the next corrective phase within the ongoing trend.
The wave cancel invalid level is set at 1.07780. This level is crucial as it validates the current wave structure. If the EURUSD pair falls below this level, it invalidates the existing wave count, signaling that the anticipated impulsive wave is no longer valid and necessitating a reevaluation of the market’s direction and wave structure.
Summary: The EURUSD Elliott Wave Analysis on the daily chart indicates a trending market in impulsive mode, with the market currently in navy blue wave 3 of the larger orange wave 3. The completion of orange wave 2 suggests the beginning of a significant upward move. The wave cancel invalid level of 1.07780 is crucial for maintaining the validity of the current wave structure, and any breach of this level would require a reassessment of the wave count.
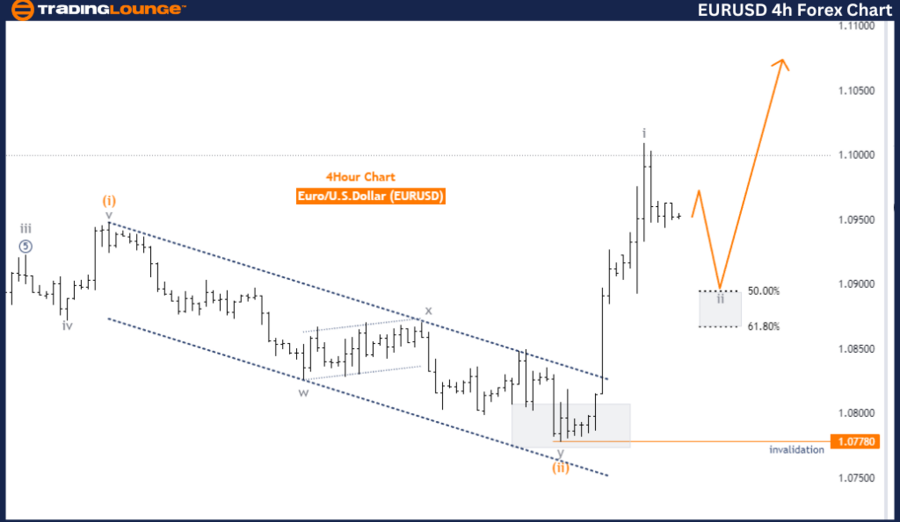
EURUSD Elliott Wave Analysis Trading Lounge 4-Hour Chart
Euro/ U.S. Dollar (EURUSD) 4-Hour Chart
EURUSD Elliott Wave Technical Analysis
Function: Counter Trend
Mode: Corrective
Structure: Gray wave 2
Position: Orange wave 3
Direction Next Higher Degrees: Gray wave 3
Details: Gray wave 1 looking completed, now gray wave 2 is in play. Wave cancel invalid level: 1.07780
The EURUSD Elliott Wave Analysis for the 4-hour chart indicates a counter-trend movement in corrective mode. The primary wave structure identified is gray wave 2, signaling a retracement within the broader trend. The current position within this structure is orange wave 3, suggesting a potential upward correction within the larger gray wave 2.
Gray wave 1 is noted as completed, implying the initial phase of the downward trend has finished. Now, gray wave 2 is in play, indicating a corrective phase that typically retraces a portion of the decline seen in gray wave 1. This phase is crucial for determining the next significant market move, as it provides insight into the strength and sustainability of the larger trend.
The analysis indicates that gray wave 2 is unfolding, usually consisting of three sub-waves (A, B, and C) in a corrective pattern. The orange wave 3 within this structure is currently developing, suggesting the market is experiencing a temporary rally or retracement against the main trend. This phase could see the price move higher before the next downward wave (gray wave 3) begins.
The wave cancel invalid level is set at 1.07780, a critical threshold for maintaining the validity of the current wave structure. If the EURUSD pair rises above this level, it invalidates the existing wave count, indicating the expected corrective pattern is no longer applicable, necessitating a reevaluation of the market’s direction and wave structure.
Summary: The EURUSD Elliott Wave Analysis on the 4-hour chart suggests a counter-trend movement in corrective mode, with the market currently in gray wave 2. The completion of gray wave 1 indicates a potential temporary rally within the broader downward trend. The wave cancel invalid level of 1.07780 is crucial for validating the current wave structure, and any breach of this level would require a reassessment of the wave count.
Technical Analyst: Malik Awais
Source: visit Tradinglounge.com and learn From the Experts Join TradingLounge Here
Previous: USDCHF Elliott Wave Technical Analysis
Special Trial Offer - 0.76 Cents a Day for 3 Months! Click here
Access 7 Analysts Over 170 Markets Covered. Chat Room With Support