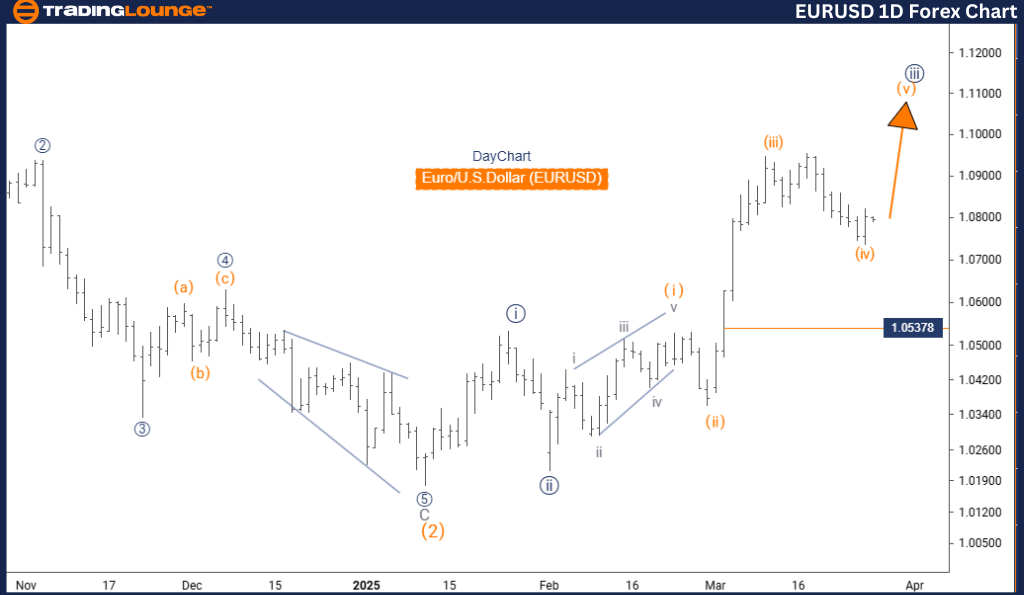
Euro / U.S. Dollar (EURUSD) Elliott Wave Analysis – TradingLounge Daily Chart
EURUSD Elliott Wave Technical Analysis
Function: Bullish Trend
Mode: ImpulsiveStructure: Orange Wave 5
Position: Navy Blue Wave 3
Direction (Next Lower Degrees): Navy Blue Wave 4
Invalidation Level: 1.05378
Technical Overview:
The daily Elliott Wave analysis of EURUSD reflects a bullish trend continuation. The primary focus is on the unfolding of orange wave 5, which develops within the structure of the broader navy blue wave 3. The prior orange wave 4 appears completed, confirming that orange wave 5 of 3 is actively progressing.
This setup represents the concluding leg of a significant upward cycle initiated by navy blue wave 1. The invalidation level is clearly marked at 1.05378. A price decline below this point would invalidate the current bullish setup and call for a structural reassessment.
Market Context:
The daily timeframe provides clarity on the impulsive nature of the current movement. As orange wave 5 continues to form, traders should prepare for an eventual transition into navy blue wave 4, which signals the onset of a corrective move. This would likely be followed by a bullish resumption through navy blue wave 5.
As orange wave 5 typically concludes an impulsive pattern, traders should watch for momentum divergences and other fifth wave indicators suggesting a potential market reversal or correction.
Strategic Implications:
Long positions remain aligned with the prevailing bullish momentum. However, given that orange wave 5 is a terminal wave, prudent risk management is essential. Tightening stop-loss levels and actively monitoring price behavior is advised to anticipate any potential correction.
This Elliott Wave perspective is particularly relevant for forex traders aiming to take advantage of the nearing completion of a strong upward EURUSD cycle.
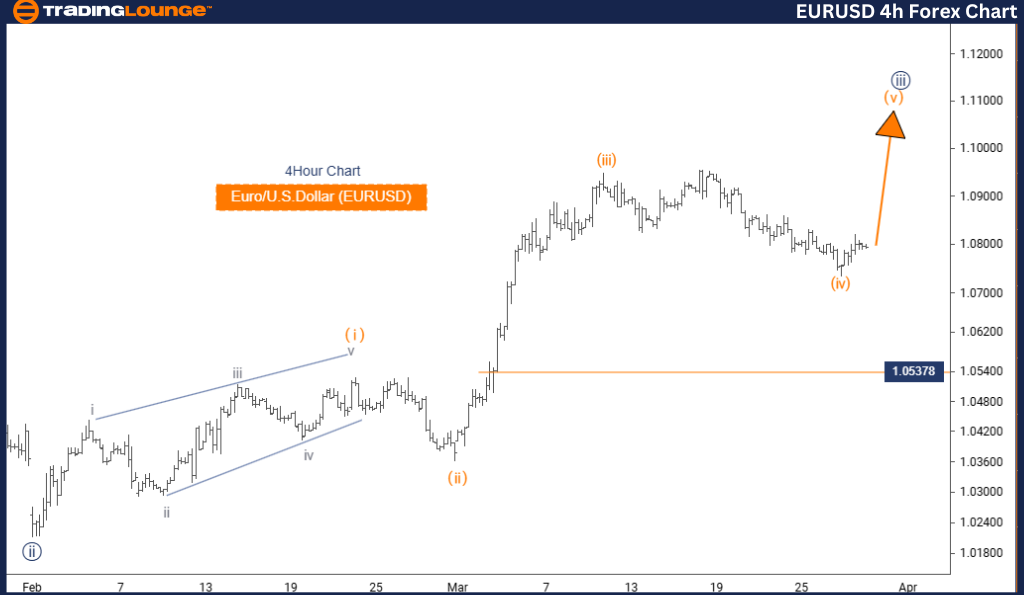
Euro / U.S. Dollar (EURUSD) Elliott Wave Analysis – TradingLounge 4-Hour Chart
EURUSD Elliott Wave Technical Analysis
Function: Trend
Mode: Impulsive
Structure: Orange Wave 5
Position: Navy Blue Wave 3
Direction (Next Lower Degrees): Navy Blue Wave 4
Invalidation Level: 1.05378
Technical Overview:
On the 4-hour chart, the EURUSD Elliott Wave structure confirms a strong bullish trend. The chart shows orange wave 5 in motion, following the completed correction of orange wave 4. This move is a part of the broader navy blue wave 3 impulsive advance.
With orange wave 5 developing, the EURUSD remains in a decisive bullish phase. As long as the price remains above the 1.05378 invalidation level, this upward structure is considered valid. A breakdown below this level would negate the current count and necessitate reevaluation.
Market Context:
This shorter-term view enhances understanding of the ongoing bullish wave structure. Once orange wave 5 concludes, traders should anticipate navy blue wave 4 to introduce a corrective pullback before another potential rise with navy blue wave 5.
Orange wave 5 phases usually exhibit strong bullish momentum, offering optimal entry points for trend-following strategies.
Strategic Implications:
Traders can maintain long positions while the bullish trend persists but should be alert for signs of momentum slowdown. Managing risk around the critical invalidation level of 1.05378 is crucial to safeguard against abrupt market shifts.
This analysis serves as a practical guide for currency traders targeting profits from the final leg of a major EURUSD bullish phase.
Technical Analyst: Malik Awais
Source: Visit Tradinglounge.com and learn from the Experts Join TradingLounge Here
Previous: NZDUSD Elliott Wave Technical Analysis
VALUE Offer - Buy 1 Month & Get 3 Months!Click here
Access 7 Analysts Over 200 Markets Covered. Chat Room With Support