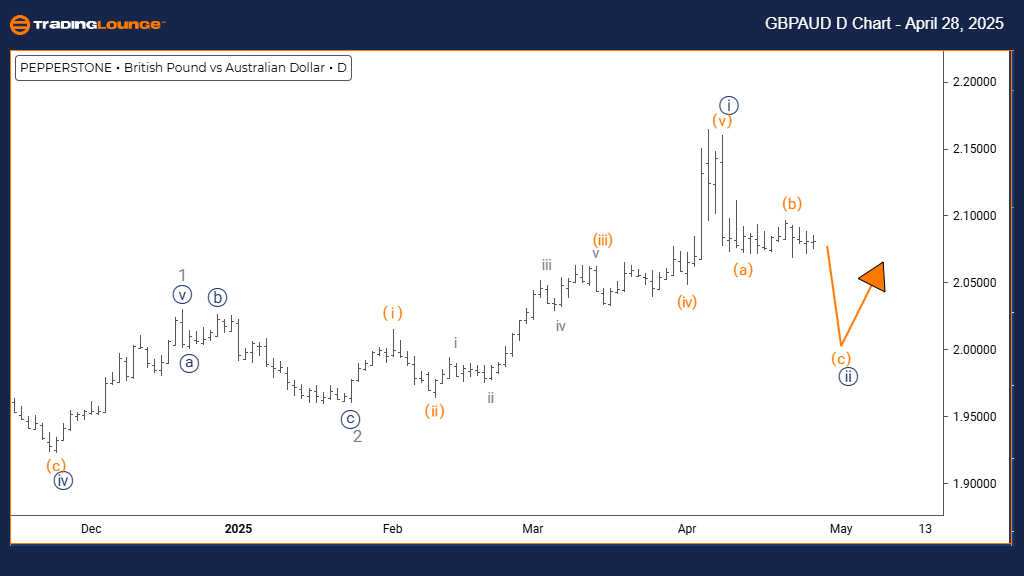
British Pound / Australian Dollar (GBPAUD) Pair – Trading Lounge Day Chart
GBPAUD Elliott Wave Technical Analysis
Function: Counter Trend
Mode: Corrective
Structure: Navy Blue Wave 2
Position: Gray Wave 3
Direction Next Higher Degrees: Navy Blue Wave 3
Details:
The British Pound to Australian Dollar (GBPAUD) Elliott Wave day chart analysis shows that navy blue wave 1 has completed, and navy blue wave 2 is currently unfolding.
The GBPAUD daily technical analysis highlights a counter-trend correction developing within a broader downtrend. After completing the navy blue wave 1 decline, GBPAUD has entered the corrective navy blue wave 2 phase, positioned within the larger gray wave 3 trend. This structure suggests that a short-term upward retracement is underway before the main bearish trend resumes.
Navy Blue Wave 2 Correction Phase
Navy blue wave 2 represents the corrective stage, typically retracing between 38% to 61% of the prior wave 1 fall. This corrective rally often features overlapping, weaker price action — characteristics typical of Elliott Wave corrective structures. On the daily chart, this retracement phase looks to serve as a temporary pause before the dominant downtrend continues.
The anticipated next move is the beginning of navy blue wave 3, expected to be the strongest and most dynamic bearish leg. Traders should closely monitor the current wave 2 development, looking for bearish reversal patterns and overbought momentum indicators to signal the end of the correction.
Trading Opportunities and Technical Insights
This corrective phase creates strategic trading opportunities for those aiming to catch the start of the next major bearish move, wave 3. Applying key technical analysis tools—such as trendlines, Fibonacci retracements, and momentum indicators—will be crucial for timing entries.
Watching price action near key Fibonacci levels will help identify prime entry points as GBPAUD prepares to transition from navy blue wave 2 into the powerful wave 3 decline. The overall Elliott Wave forecast on the daily chart emphasizes that this correction is pivotal in the broader bearish trend.
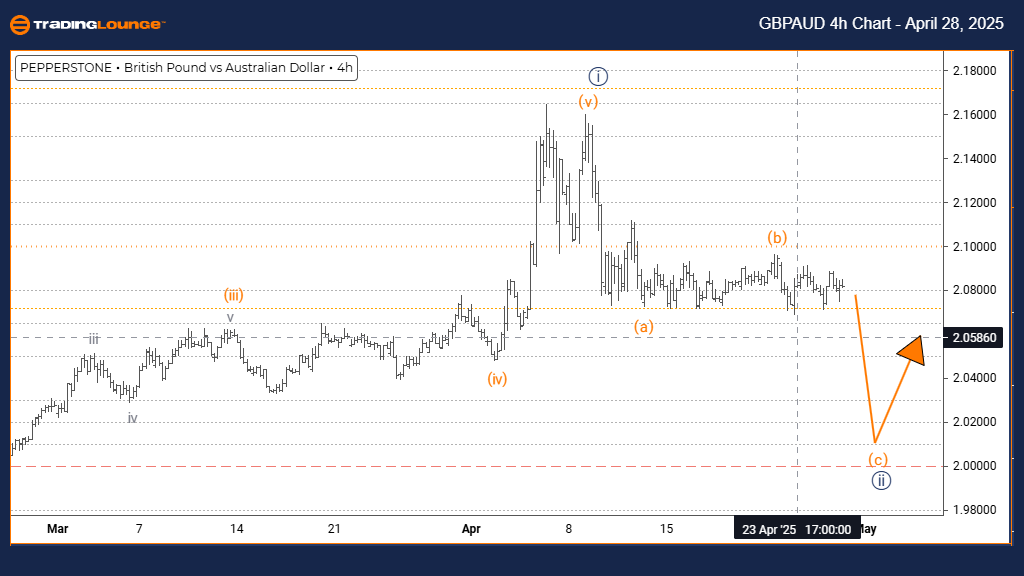
British Pound / Australian Dollar (GBPAUD) – 4-Hour Chart
GBPAUD Elliott Wave Technical Analysis
Function: Counter Trend
Mode: Impulsive as C
Structure: Orange Wave C
Position: Navy Blue Wave 2
Direction Next Higher Degrees: Navy Blue Wave 3
Details:
The 4-hour GBPAUD Elliott Wave analysis shows that orange wave B is complete, and the pair is now advancing in orange wave C of navy blue wave 2.
The GBPAUD 4-hour chart highlights an ongoing counter-trend correction within the broader bearish framework. Having completed the orange wave B retracement, the pair is now advancing through orange wave C, representing the final leg of the navy blue wave 2 correction before the dominant bearish trend is expected to resume.
Orange Wave C Progression
Orange wave C signifies the final phase of the counter-trend correction and often carries strong momentum. Following the end of wave B, the upward movement in wave C can extend higher sharply before the corrective structure finalizes. Technical indicators suggest this bullish momentum should persist until the conclusion of orange wave C.
Upon the completion of orange wave C, GBPAUD is forecasted to resume its major downtrend with the navy blue wave 3 decline. This next move is projected to push prices significantly lower as the larger bearish Elliott Wave sequence reasserts itself.
Trading Strategy and Technical Considerations
Traders should focus on monitoring the characteristics of orange wave C, particularly strong bullish momentum and clear wave progression patterns. These signals are vital for anticipating the end of the correction and preparing for the resumption of the downtrend.
This stage offers actionable trading opportunities to position ahead of navy blue wave 3. Careful observation of price behavior and technical signals—especially around key resistance levels—will be essential for confirming the end of the corrective phase. The 4-hour GBPAUD Elliott Wave outlook points toward an imminent major directional shift, favoring the downside.
Technical Analyst: Malik Awais
Source: Visit Tradinglounge.com and learn from the Experts. Join TradingLounge Here
Previous: EURGBP Elliott Wave Technical Analysis
VALUE Offer - Buy 1 Month & Get 3 Months!Click here
Access 7 Analysts Over 200 Markets Covered. Chat Room With Support