25Mar

Gold Elliott Wave Analysis March 2025: Price Forecast, Fibonacci Support Zones, Bullish Trend Continuation, and Trade Opportunities

Gold Elliott Wave Analysis

Gold prices have entered a corrective phase after setting a new all-time high on March 20, 2025. This retracement appears to be temporary, with the broader bullish trend still intact. The upward cycle that began in November 2024 continues to show strength, and further upside is expected before a significant retracement occurs.


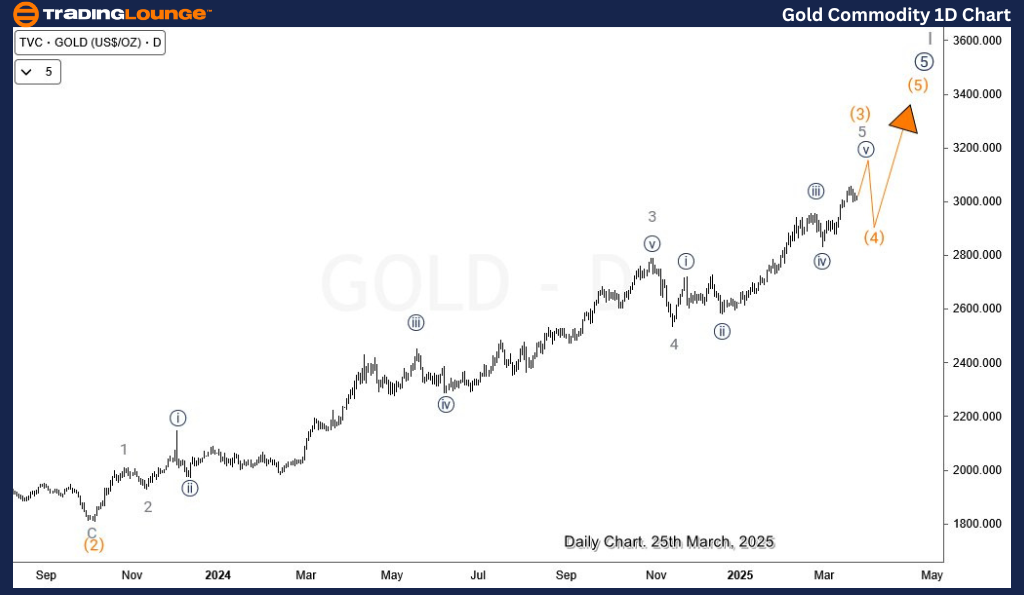
Gold Daily Chart Analysis

The daily chart underscores gold’s persistent bullish momentum. After completing wave (2) in October 2023, the market transitioned into wave (3), which has been advancing in a well-defined impulsive structure. Current Elliott Wave projections suggest that wave (3) still has upward potential.

Detailed subwave analysis within wave (3) shows it is nearing the final stage. The incomplete wave ((v)) of 5 of (3) suggests one more bullish leg is needed to complete this phase. Upon completion of wave (3), a corrective pullback in wave (4) is anticipated, before the market resumes its ascent toward finalizing wave I that originated in December 2015.

Gold-commodity-1d-ch...


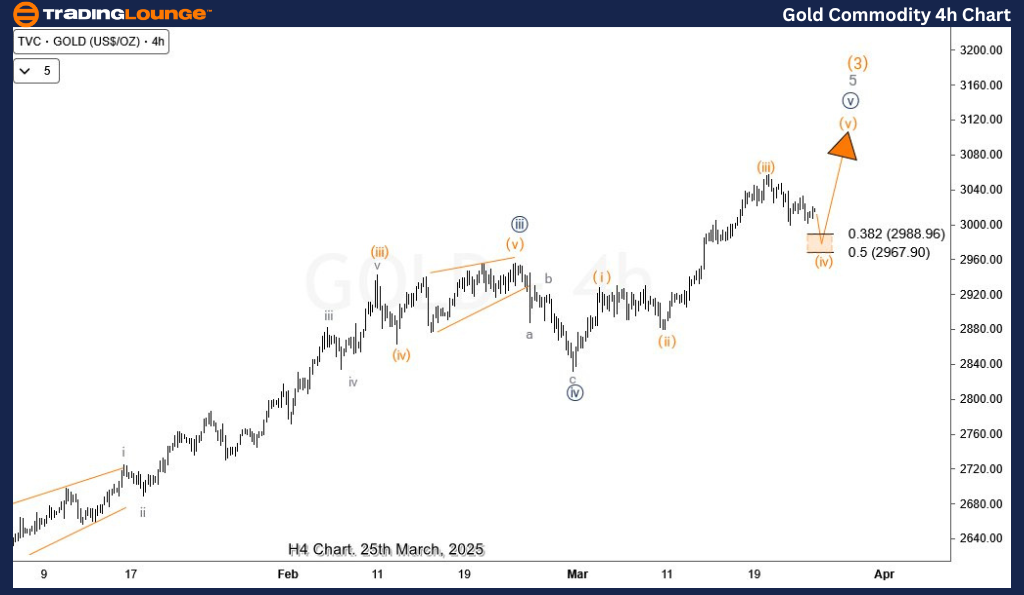
Gold H4 Chart Analysis

The H4 chart reveals the recent decline from the March 20 high as part of wave (iv) of ((v)) of 5 of (3). This structure aligns with typical fourth-wave corrections, which generally find support between the 38.2% and 50% Fibonacci retracement levels. Shallower retracements may bottom between the 23.6% and 38.2% zones.

Initial movement in this pullback followed a three-wave corrective pattern, followed by a minor rebound—indicating a potential double correction. If this count remains valid, gold could complete wave (iv) within the Fibonacci support range of 2988.9–2967.9. This zone may trigger renewed buying pressure, driving a rally in wave (v) that could lead to fresh highs.

Traders should monitor bullish reversal signals near this critical support region. Given the prevailing uptrend, any confirmed bounce from this zone could present a strong risk-reward opportunity for traders targeting trend continuation setups.

Technical Analyst: Sanmi Adeagbo

Source: Visit Tradinglounge.com and learn from the Experts Join TradingLounge Here 

See Previous: GX URA Elliott Wave Technical Analysis

VALUE Offer - Buy 1 Month & Get 3 Months!Click here

Access 7 Analysts Over 200 Markets Covered. Chat Room With Support

Gold-commodity-4h-ch...

Related

Best stocks to buy in the Swiss Market Index SMI Elliott Wave Technical Analysis and SMI Market Forecasts

Best stocks to buy in the Swiss Market Index SMI Elliott Wave Technical Analysis and SMI Market Forecasts

Get a detailed Swiss Market Index (SMI) analysis using Elliott Wave Theory. Learn about the latest S...

Read More >
Exploring ASX Trading Success: ASX LIMITED – ASX Stock Analysis & Elliott Wave Technical Forecast

Exploring ASX Trading Success: ASX LIMITED – ASX Stock Analysis & Elliott Wave Technical Forecast

Dive deep into the financial waters of ASX Limited with our detailed analysis. Leveraging Elliott Wa...

Read More >
Gold (XAUUSD) Elliott Wave Technical Analysis: Points to a Potential Surge to $2200

Gold (XAUUSD) Elliott Wave Technical Analysis: Points to a Potential Surge to $2200

our analysis suggests a favorable outlook for Gold, presenting potential buying opportunities for tr...

Read More >
Navigating Markets: Weekly Forex, Crypto, Stocks Insights & Trade Opportunities (5th-9th February 2024)

Navigating Markets: Weekly Forex, Crypto, Stocks Insights & Trade Opportunities (5th-9th February 2024)

Explore our Weekly Elliott Wave Analysis Report (5th-9th February 2024) for expert insights and trad...

Read More >
Stocks Bullish Trend: AAPL, AMZN, NVDA, TSLA, GOOGL, META, NFLX, MSFT, Elliott Wave Analysis

Stocks Bullish Trend: AAPL, AMZN, NVDA, TSLA, GOOGL, META, NFLX, MSFT, Elliott Wave Analysis

Explore the latest Commodities Market Technical Analysis, focusing on Bitcoin's potential ascent...

Read More >
Tesla Inc.(TSLA:NASDAQ) Elliott Wave Technical Analysis 9 November 23

Tesla Inc.(TSLA:NASDAQ) Elliott Wave Technical Analysis 9 November 23

Tesla Inc.(TSLA: NASDAQ) Elliott Wave Technical Analysis on 9 November 23, and TSLA Stock Market Ana...

Read More >

$1 for 2 Weeks

then $29 a month!

What a Special Offer!

Trade Recommendations

Unleash the power of deversified trading with our comprehensive portfolio, covering 250+ markets:

  • Stock Trades
  • Crypto Trades
  • Forex Trades
  • Commodity Trades
Elliott Wave Analysis

Gain a competitive edge with expert insights and AI-powered Elliott Wave charting into:

  • Global Indices
  • US Stocks & ASX Stocks
  • Forex & Crypto
  • Commodities
Top-Notch Trading Tools

Equip yourself with the tools of success:

  • Real-time Chat rooms
  • Elliott Wave Algorithm
  • Portfolio tools
  • TradingLevels
  • Screener
  • Trading Game
7 Elliott Wave Analysts

Stay ahead of the market with daily charts and insightful videos
Your secret to strategic trading!

JOIN HERE


Welcome to TradingLounge (ASIC A.R.No. 321187), specialists in trades, trading education and technical analysis, covering stocks, indices, commodities, forex and cryptocurrencies.

When you join TradingLounge you have access to everything we offer, including trade tools, educational content and a social platform to chat with like-minded investors.

Read more

@Copyright 2024 by tradinglounge.com

Contact Us

Australian no: 02 4787 6020

International no: +61 (2) 47876020

Pay with:

Find us on