21Mar

URA Elliott Wave Analysis: Detailed Uranium ETF Forecast, Market Trends, and Long-Term Buying Opportunities in the Uranium Sector

GX URA Elliott Wave Analysis

The Global X Uranium ETF (URA) is a popular exchange-traded fund providing exposure to uranium mining, exploration, production, and nuclear energy companies. Managed by Global X ETFs, URA tracks the Solactive Global Uranium & Nuclear Components Total Return Index, making it a key investment vehicle for those looking to capitalize on the uranium sector.

URA’s Corrective Phase: Elliott Wave Perspective

URA has seemingly completed the first leg of its corrective phase, following a long-term 5-wave diagonal structure that peaked at $34 in October 2024. This decline represents the initial part of a three-wave correction. The ongoing retracement, labelled as wave (b), remains within an upward corrective structure but is expected to stay capped below $34 before turning lower in wave (c) to complete the correction.

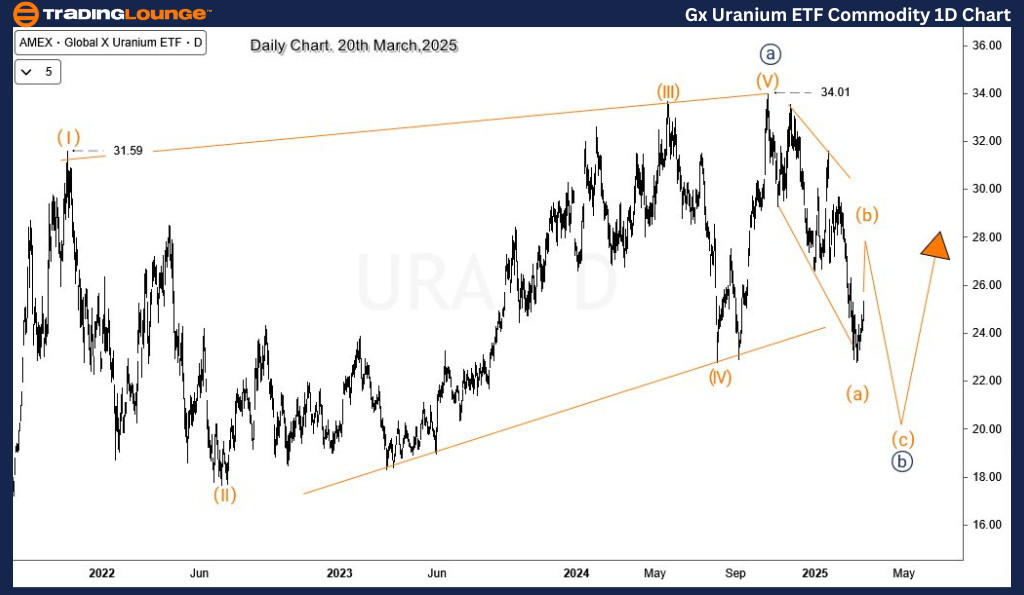
URA Daily Chart – 5-Wave Rally & Correction in Motion

The daily chart highlights a strong 5-wave diagonal structure that began in March 2022, propelling URA from below $7 to $34 by October 2024. According to Elliott Wave Theory, a completed 5-wave advance is usually followed by a 3-wave corrective move.

  • The pullback from $34 appears to have completed an expanding diagonal as wave (a) of ((b)), marking the initial phase of the correction.
  • Currently, the wave (b) retracement is unfolding, forming a corrective pattern that is expected to stay below $34.
  • Once wave (b) completes, another leg lower in wave (c) of ((b)) is anticipated, leading to a deeper retracement before the broader bullish cycle resumes from the March 2020 low.

GX-Uranium-ETF-URA-C...


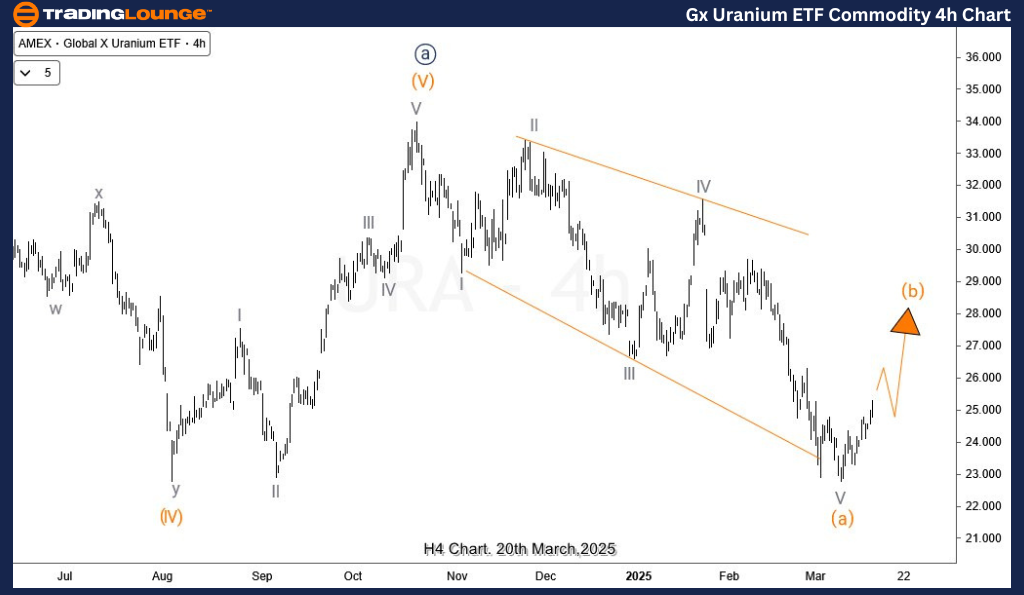
URA H4 Chart – Wave (b) Developing, Limited Upside

On the 4-hour chart, the subdivisions of wave (a) confirm the corrective nature of the decline. The ongoing wave (b) retracement is progressing and could push higher into the $28-$30 range before facing resistance.

  • Despite the wave (b) bounce, the overall correction remains valid as long as the price stays below $34.
  • A decline in wave (c) of ((b)) is expected once wave (b) completes, providing an opportunity for deeper retracement before the next bullish cycle begins.

Upon completion of wave ((b)), the broader uptrend is likely to resume, potentially presenting new long-term buying opportunities for investors.

Technical Analyst: Sanmi Adeagbo

Source: Visit Tradinglounge.com and learn from the Experts Join TradingLounge Here 

See Previous: Corn Elliott Wave Technical Analysis

VALUE Offer - Buy 1 Month & Get 3 Months!Click here

Access 7 Analysts Over 200 Markets Covered. Chat Room With Support

GX-Uranium-ETF-URA-C...

Related

Watch CAT Stock Progresses through its Current Market Structure Using Caterpillar Inc. (CAT) Elliott Wave Technical Analysis

Watch CAT Stock Progresses through its Current Market Structure Using Caterpillar Inc. (CAT) Elliott Wave Technical Analysis

This article provides a comprehensive Elliott Wave analysis of Caterpillar Inc. (CAT), examining bot...

Read More >
Tata Consumer Product Stock Analysis: Elliott Wave Insights, Key Levels, Price Predictions, and Daily & 4H Chart Breakdown

Tata Consumer Product Stock Analysis: Elliott Wave Insights, Key Levels, Price Predictions, and Daily & 4H Chart Breakdown

Analyze Tata Consumer Product (TATACONSUM) stock with Elliott Wave principles. Get insights into wav...

Read More >
Detailed Elliott Wave Analysis of ASX Sonic Healthcare Limited (SHL) with Stock Forecasts, Price Targets, and Market Predictions

Detailed Elliott Wave Analysis of ASX Sonic Healthcare Limited (SHL) with Stock Forecasts, Price Targets, and Market Predictions

This detailed Elliott Wave analysis of ASX Sonic Healthcare Limited (SHL) provides insights into the...

Read More >
Unlocking ASX Trading Success: NORTHERN STAR RESOURCES LTD – NST Stock Analysis & Elliott Wave Technical Forecast

Unlocking ASX Trading Success: NORTHERN STAR RESOURCES LTD – NST Stock Analysis & Elliott Wave Technical Forecast

This article provides a comprehensive Elliott Wave technical analysis of Northern Star Resources Ltd...

Read More >
Costco Wholesale Corp. (COST) Elliott Wave Technical Analysis: Stay Updated on Stock Trends and Make Informed Trading Decisions

Costco Wholesale Corp. (COST) Elliott Wave Technical Analysis: Stay Updated on Stock Trends and Make Informed Trading Decisions

This analysis provides a detailed Elliott Wave review of Costco Wholesale Corp. (COST), covering the...

Read More >

$1 for 2 Weeks

then $29 a month!

What a Special Offer!

Trade Recommendations

Unleash the power of deversified trading with our comprehensive portfolio, covering 250+ markets:

  • Stock Trades
  • Crypto Trades
  • Forex Trades
  • Commodity Trades
Elliott Wave Analysis

Gain a competitive edge with expert insights and AI-powered Elliott Wave charting into:

  • Global Indices
  • US Stocks & ASX Stocks
  • Forex & Crypto
  • Commodities
Top-Notch Trading Tools

Equip yourself with the tools of success:

  • Real-time Chat rooms
  • Elliott Wave Algorithm
  • Portfolio tools
  • TradingLevels
  • Screener
  • Trading Game
7 Elliott Wave Analysts

Stay ahead of the market with daily charts and insightful videos
Your secret to strategic trading!

JOIN HERE


Welcome to TradingLounge (ASIC A.R.No. 321187), specialists in trades, trading education and technical analysis, covering stocks, indices, commodities, forex and cryptocurrencies.

When you join TradingLounge you have access to everything we offer, including trade tools, educational content and a social platform to chat with like-minded investors.

Read more

@Copyright 2024 by tradinglounge.com

Contact Us

Australian no: 02 4787 6020

International no: +61 (2) 47876020

Pay with:

Find us on