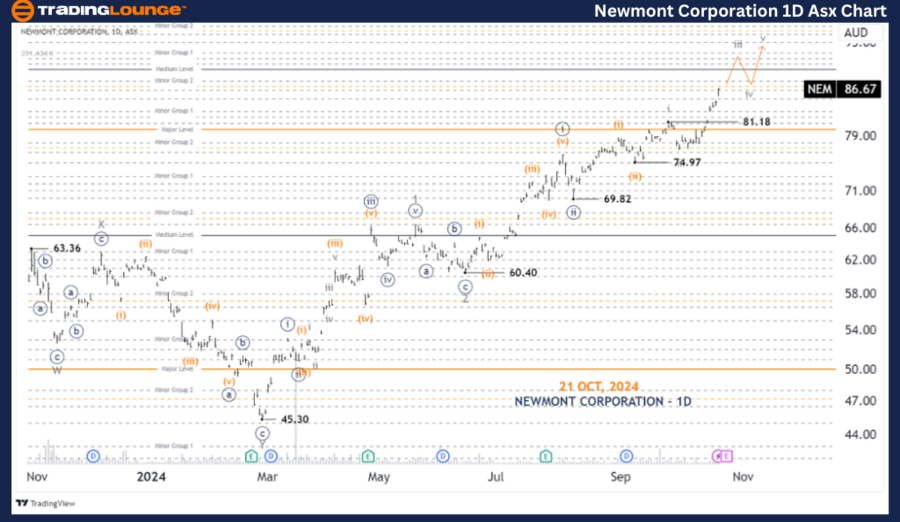
ASX: NEWMONT CORPORATION - TradingLounge 1D Chart
Greetings, Our Elliott Wave analysis today provides an update on the Australian Stock Exchange (ASX) for NEWMONT CORPORATION - NEM. We observe that NEM continues its upward momentum.
ASX: NEWMONT CORPORATION - NEM 1D Chart (Semilog Scale) Analysis
NEM Elliott Wave Technical Analysis
Function: Major trend (Minute degree, navy)
Mode: Motive
Structure: Impulse
Position: Wave iii-grey of Wave (iii)-orange of Wave ((iii))-navy of Wave 3-grey
Details: Wave iii-grey is still developing and pushing higher, potentially reaching 90.00. After this, wave iv-grey may pull back slightly before wave v-grey resumes its upward movement.
Invalidation Point: 81.18

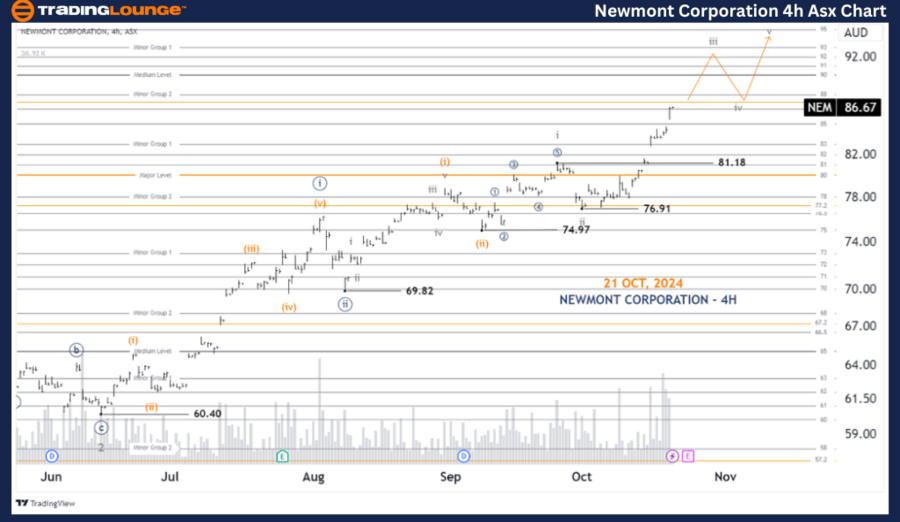
ASX: NEWMONT CORPORATION - NEM 4-Hour Chart Analysis
Function: Major trend (Subminuette degree, grey)
Mode: Motive
Structure: Impulse
Position: Wave iii-grey of Wave (iii)-orange of Wave ((iii))-navy
Details: Since the low at 76.91, wave iii-grey has been moving higher. It could potentially target the 90.00 level before wave iv-grey pulls back. Subsequently, wave v-grey is expected to continue the upward trajectory.
Invalidation Point: 81.18
Technical Analyst: Hua (Shane) Cuong, CEWA-M (Master’s Designation).
Source: visit Tradinglounge.com and learn From the Experts Join TradingLounge Here
See Previous: CSL LIMITED Elliott Wave Technical Analysis
VALUE Offer - Buy 1 Month & Get 3 Months!Click here
Access 7 Analysts Over 200 Markets Covered. Chat Room With Support

Conclusion
Our analysis of the current Elliott Wave structure for ASX: NEWMONT CORPORATION - NEM highlights key market trends and price points. These levels serve as validation or invalidation signals, giving traders enhanced confidence in their positions. By closely monitoring these points, traders can make more informed decisions in line with the broader market outlook.