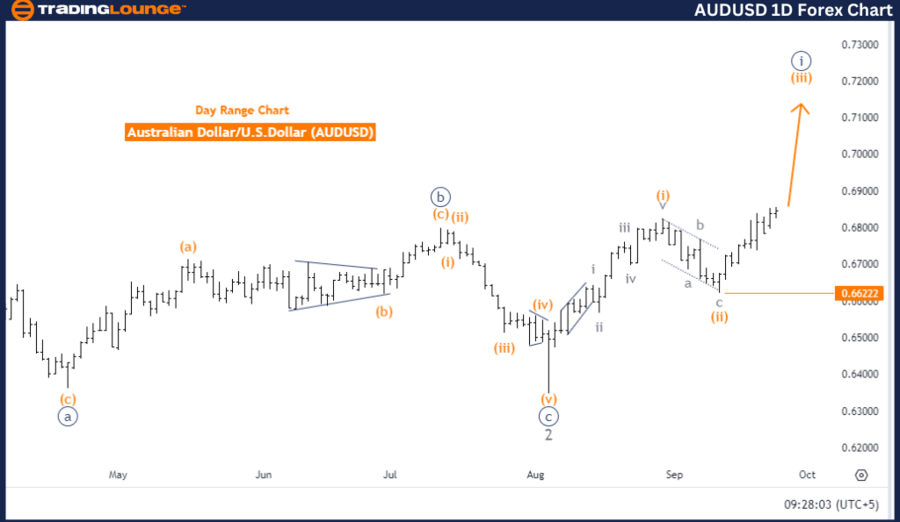
AUDUSD Elliott Wave Analysis - Trading Lounge Day Chart
Australian Dollar/U.S. Dollar (AUDUSD) Day Chart
AUDUSD Elliott Wave Technical Analysis
FUNCTION: Bullish Trend
MODE: Impulsive
STRUCTURE: Orange Wave 3
POSITION: Navy Blue Wave 1
DIRECTION NEXT LOWER DEGREES: Orange Wave 4
DETAILS: Orange Wave 2 appears completed, and now Orange Wave 3 is in progress.
Wave Cancel Invalid Level: 0.66222
The AUDUSD Elliott Wave analysis on the daily chart indicates a bullish trend developing in an impulsive mode. The current wave pattern identifies Orange Wave 3, suggesting that the market is advancing in the third wave of a typical five-wave sequence, known for strong upward momentum. The position is Navy Blue Wave 1, highlighting that the market remains in the early stages of a broader uptrend.
According to the analysis, Orange Wave 2, which represents the corrective phase, has likely concluded, and Orange Wave 3 is actively pushing the market higher. Wave 3 is usually considered the most powerful in an impulsive wave sequence, which suggests potential for further upward movement in upcoming sessions.
Looking ahead, the next anticipated direction at a lower degree is Orange Wave 4. This means that once Orange Wave 3 concludes, the market may experience a brief corrective phase (Wave 4) before resuming its bullish momentum in Wave 5. The invalidation level for this wave structure is set at 0.66222. If the price drops below this level, the current Elliott Wave analysis would be invalidated, requiring a new outlook on the market.
In conclusion, the AUDUSD daily chart reflects a strong bullish trend. With Orange Wave 2 completed and Orange Wave 3 driving prices upward, the outlook remains positive unless the price falls below 0.66222. Further gains are expected as the bullish trend progresses, with a potential correction in Wave 4 after the completion of Wave 3.
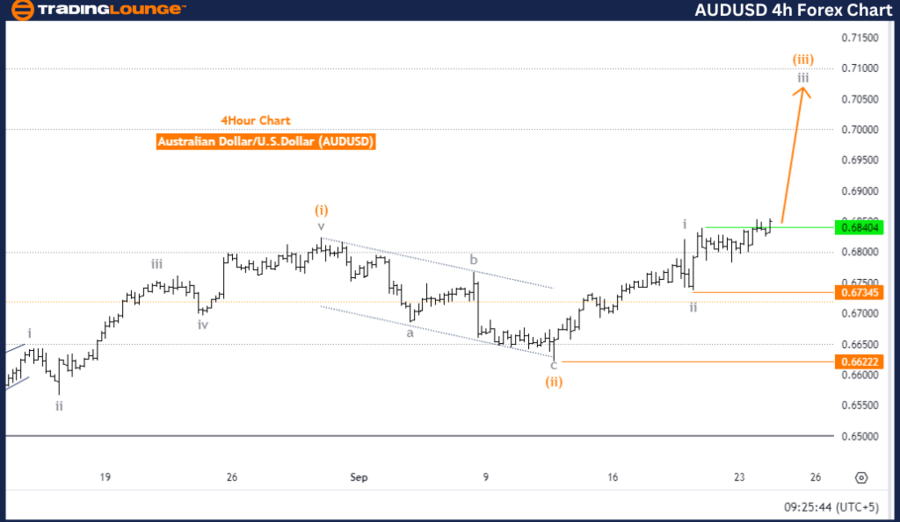
Australian Dollar/U.S. Dollar (AUDUSD) 4 Hour Chart Analysis
AUDUSD Elliott Wave Technical Analysis
FUNCTION: Bullish Trend
MODE: Impulsive
STRUCTURE: Gray Wave 3
POSITION: Orange Wave 3
DIRECTION NEXT LOWER DEGREES: Gray Wave 4
DETAILS: Gray Wave 2 appears completed, and now Gray Wave 3 is in play.
Wave Cancel Invalid Level: 0.66222
The AUDUSD Elliott Wave analysis on the 4-hour chart shows a developing bullish trend in an impulsive mode. The current wave pattern identifies Gray Wave 3, indicating that the market is advancing in the third wave of a larger five-wave sequence, which often aligns with strong upward momentum. The position within this structure is Orange Wave 3, suggesting that the market is still advancing in its upward trend, with further potential for gains.
This analysis shows that Gray Wave 2, a corrective phase in the broader trend, has likely completed, and now Gray Wave 3 is actively driving the market higher. Typically, Wave 3 is the longest and most powerful in a five-wave sequence, which further supports expectations for continued upward movement in the market.
The next direction at a lower degree is Gray Wave 4, indicating that after Gray Wave 3 completes, the market may enter a temporary corrective phase before resuming the bullish trend. The invalidation level for this wave structure is set at 0.66222. If the price falls below this level, the current wave structure will be invalidated, and a new market analysis would be required.
In summary, the AUDUSD 4-hour chart continues to reflect a strong bullish trend, with Gray Wave 3 currently leading the market higher. The completion of Gray Wave 2 has cleared the path for additional upward movement. Unless the price drops below 0.66222, the current wave structure remains valid, and further gains are anticipated as the bullish trend continues.
Technical Analyst: Malik Awais
Source: visit Tradinglounge.com and learn From the Experts Join TradingLounge Here
Previous: New Zealand Dollar/ U.S. Dollar (NZDUSD) Elliott Wave Technical Analysis
VALUE Offer - Buy 1 Month & Get 3 Months!Click here
Access 7 Analysts Over 200 Markets Covered. Chat Room With Support