USDJPY Elliott Wave Analysis – TradingLounge Daily Chart
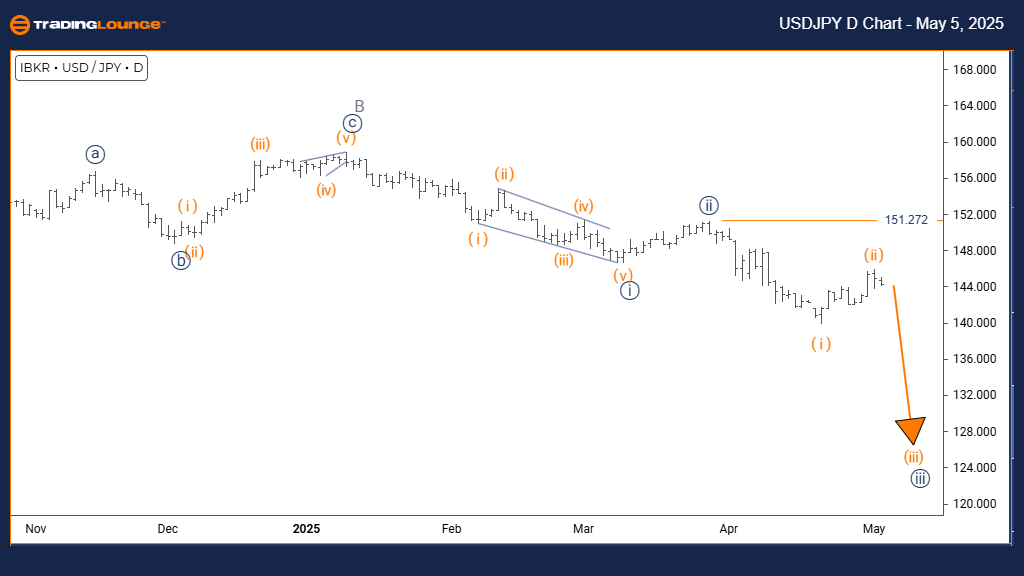
U.S. Dollar / Japanese Yen (USDJPY) Daily Chart Analysis
USDJPY Elliott Wave Technical Analysis
FUNCTION: Bearish Trend
MODE: Impulsive
STRUCTURE: Orange Wave 3
POSITION: Navy Blue Wave 3
DIRECTION NEXT LOWER DEGREES: Orange Wave 3 (in progress)
DETAILS: Orange Wave 2 appears complete; Orange Wave 3 has commenced.
Wave Cancel Invalid Level: 151.272
Daily Chart Analysis Overview
The USDJPY daily Elliott Wave analysis reveals a developing bearish trend through a strong impulsive wave structure. The U.S. Dollar/Japanese Yen (USDJPY) pair has completed Orange Wave 2 and now entered Orange Wave 3, positioned within the broader Navy Blue Wave 3. This movement signals the most powerful phase of the bearish cycle, typically characterised by sharp declines and intense momentum.
Orange Wave 3 is usually the strongest segment within the Elliott Wave framework, often resulting in major price moves. Following the conclusion of Wave 2’s correction, the current Wave 3 decline is expected to surpass Wave 1’s depth. This setup implies that the downward momentum should remain dominant before any substantial corrective waves appear.
Market Structure and Strategy Insights
The daily timeframe provides vital confirmation of the ongoing Elliott Wave structure, showcasing a critical point in the broader bearish trend. The advancement into Navy Blue Wave 3 suggests a major downward cycle unfolding across multiple timeframes. A crucial invalidation level stands at 151.272—a daily close above this point would demand a reassessment of the bearish scenario.
Traders are advised to monitor the characteristics of Orange Wave 3: robust momentum, increased volume during declines, and consistent lower lows. The strategy remains firmly bearish, favoring continuation through the impulsive wave while remaining vigilant for any signals of Wave 3’s termination. Supportive technical indicators and clear price action will provide necessary trading confirmations.
Next Phase and Trading Opportunities
Looking ahead, the next important development is the emergence of Orange Wave 4 after Orange Wave 3 concludes. This minor corrective phase should offer a temporary pullback opportunity before the broader bearish trend resumes. Current conditions highly favor trend-following strategies, with Wave 3 typically presenting the best Elliott Wave trading setups.
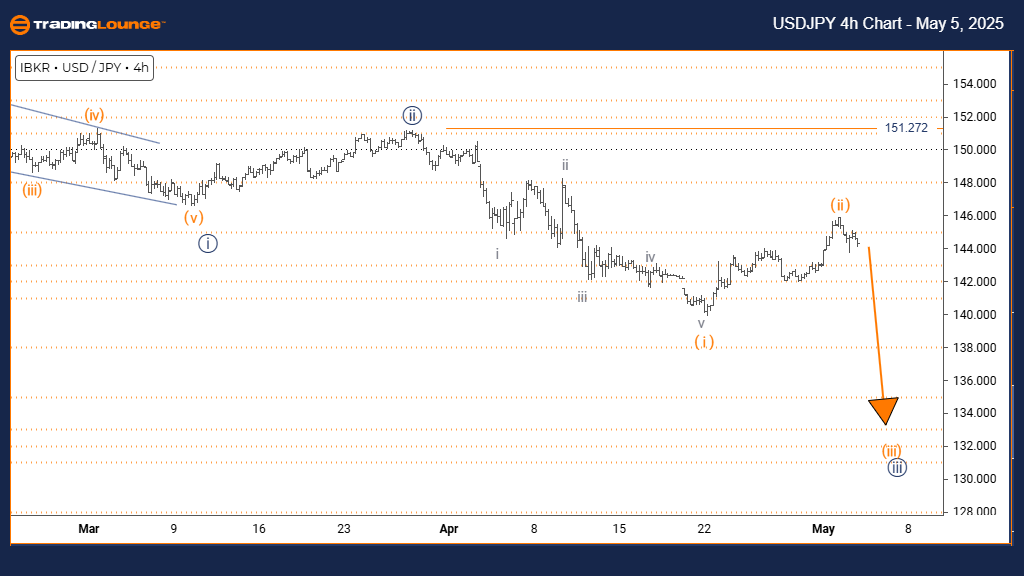
U.S. Dollar / Japanese Yen (USDJPY) 4-Hour Chart Analysis
USDJPY Elliott Wave Technical Analysis
FUNCTION: Bearish Trend
MODE: Impulsive
STRUCTURE: Orange Wave 3
POSITION: Navy Blue Wave 3
DIRECTION NEXT LOWER DEGREES: Orange Wave 3 (active)
DETAILS: Orange Wave 2 appears complete; Orange Wave 3 underway.
Wave Cancel Invalid Level: 151.272
4-Hour Chart Analysis Overview
The USDJPY 4-hour Elliott Wave analysis illustrates a firmly developing bearish trend within an impulsive structure. The U.S. Dollar/Japanese Yen (USDJPY) pair completed Orange Wave 2 and has initiated Orange Wave 3, nested inside the larger Navy Blue Wave 3 sequence. This phase marks the most dynamic part of the downtrend, often bringing steep declines and high volatility.
Orange Wave 3 generally represents the most aggressive portion of Elliott Wave sequences, often producing the largest and swiftest moves. Now that the correction of Wave 2 is complete, Wave 3’s descent is expected to outperform Wave 1’s decline. Current analysis supports a strong bearish continuation before the next correction phase.
Market Structure and Trading Strategy
The 4-hour chart provides critical insights into the active market dynamics, highlighting a pivotal point within the larger bearish trend. Advancing into Navy Blue Wave 3 signals a longer-term downtrend across broader timeframes. The key invalidation level at 151.272 remains critical—any break above would invalidate the current bearish Elliott Wave scenario.
Traders should closely observe Orange Wave 3's unfolding characteristics: vigorous downside momentum, rising sell volumes, and clear lower pivot points. The trading strategy favors maintaining bearish positions during this impulsive wave, with close attention to potential signs of Wave 3 maturity. Price action and technical indicators will guide optimal trading decisions.
Next Steps and Market Expectations
The next anticipated movement is the development of Orange Wave 4 once Orange Wave 3 finishes. This corrective wave will likely offer a short-term countertrend trading opportunity before the larger bearish trend potentially reasserts itself. This period remains ideal for trend-following strategies, as Wave 3 phases generally provide the strongest Elliott Wave trading conditions.
Technical Analyst: Malik Awais
Source: Visit Tradinglounge.com and learn from the Experts. Join TradingLounge Here
Previous: EURGBP Elliott Wave Technical Analysis
VALUE Offer - Buy 1 Month & Get 3 Months!Click here
Access 7 Analysts Over 200 Markets Covered. Chat Room With Support