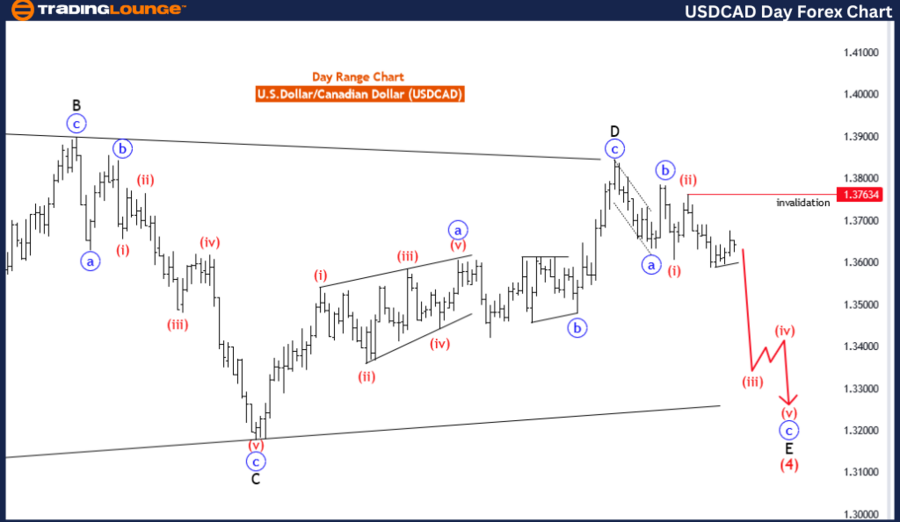
USDCAD Elliott Wave Analysis Trading Lounge Day Chart
U.S. Dollar/Canadian Dollar (USD/CAD) Day Chart Analysis
USD/CAD Elliott Wave Technical Analysis
Function: Counter Trend
Mode: Impulsive
Structure: Red Wave 3
Position: Blue Wave C
Direction Next Higher Degrees: Red Wave 4
Details: Red Wave 2 of C completed at 1.37634, now Red Wave 3 is in play.
Wave Cancel Invalid Level: 1.37634
The USD/CAD Elliott Wave analysis on the daily chart offers valuable insights into the current market dynamics of this currency pair. The analysis identifies the primary function as a counter-trend, indicating movements contrary to the broader trend. The mode of the wave structure is classified as impulsive, suggesting strong, decisive price actions.
The main structure identified is Red Wave 3, a significant segment in the Elliott Wave sequence known for sustained price movements. Currently, the position within this structure is Blue Wave C, marking an active phase.
Looking ahead, the direction for the next higher degrees points to Red Wave 4. This projection is crucial as it anticipates a corrective phase following the impulsive Red Wave 3 movements. Typically, Red Wave 4 involves a retracement of the previous gains, essential for the market's natural ebb and flow.
Key details highlight that Red Wave 2 of the current Wave C structure was completed at 1.37634. This completion paves the way for Red Wave 3, marking a dynamic phase in the Elliott Wave cycle characterized by strong market movements.
An important aspect is the wave cancel invalid level set at 1.37634. If the market price surpasses this level, it invalidates the current wave count and requires a reassessment of the wave structure. This level serves as a checkpoint to confirm the Elliott Wave pattern's accuracy and expected market behavior.
In summary, the USD/CAD pair is experiencing an impulsive counter-trend phase within Red Wave 3 on the daily chart. With Red Wave 2 of C completed, the market is now in the dynamic phase of Red Wave 3, with expectations of transitioning to Red Wave 4 next. Monitoring the invalidation level is crucial for validating the current wave structure and future market projections.
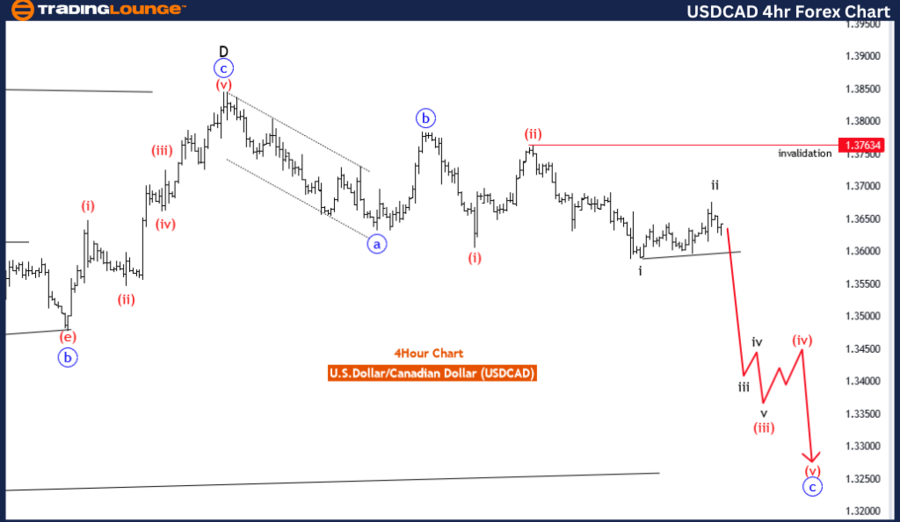
USDCAD Elliott Wave Analysis Trading Lounge 4-Hour Chart
U.S. Dollar/Canadian Dollar (USD/CAD) 4-Hour Chart
USD/CAD Elliott Wave Technical Analysis
Function: Counter Trend
Mode: Impulsive
Structure: Black Wave 3
Position: Red Wave 3
Direction Next Higher Degrees: Black Wave 4
Details: Black Wave 2 of 3 completed at 1.36781, now Black Wave 3 of Red Wave 3 is in play.
Wave Cancel Invalid Level: 1.37634
The USD/CAD Elliott Wave analysis on the 4-hour chart provides a detailed view of the current market dynamics. The analysis identifies the function as a counter trend, indicating movements against the prevailing larger trend. The mode of the wave structure is impulsive, suggesting strong, decisive price actions.
The primary structure identified is Black Wave 3, a critical phase in the Elliott Wave sequence known for significant price movements. The current position within this structure is Red Wave 3, indicating an active phase with substantial price shifts.
The direction for the next higher degrees projects a transition into Black Wave 4 after completing the current wave. This projection is crucial as it anticipates a corrective phase following the impulsive movements of Black Wave 3, usually involving some retracement of previous gains.
Key details highlight that Black Wave 2 of the current sequence completed at 1.36781, setting the stage for Black Wave 3 of Red Wave 3. This phase is particularly significant as it often represents one of the most powerful parts of the Elliott Wave cycle, involving strong upward or downward movements.
The wave cancel invalid level, set at 1.37634, is a critical aspect. If the market price exceeds this level, it invalidates the current wave count and necessitates a reevaluation of the wave structure. This level acts as a crucial checkpoint to confirm the Elliott Wave pattern's accuracy and expected market behavior.
In summary, the USD/CAD pair is in an impulsive counter-trend phase within Black Wave 3 of Red Wave 3 on the 4-hour chart. With Black Wave 2 completed, the market is experiencing the dynamic phase of Black Wave 3, with expectations of transitioning to Black Wave 4 next. Monitoring the invalidation level is essential for validating the current wave structure and future market projections.
Technical Analyst: Malik Awais
Source: visit Tradinglounge.com and learn From the Experts Join TradingLounge Here
Previous: British Pound/ Australian Dollar (GBPAUD) Elliott Wave Technical Analysis
Special Trial Offer - 0.76 Cents a Day for 3 Months! Click here
Access 7 Analysts Over 170 Markets Covered. Chat Room With Support