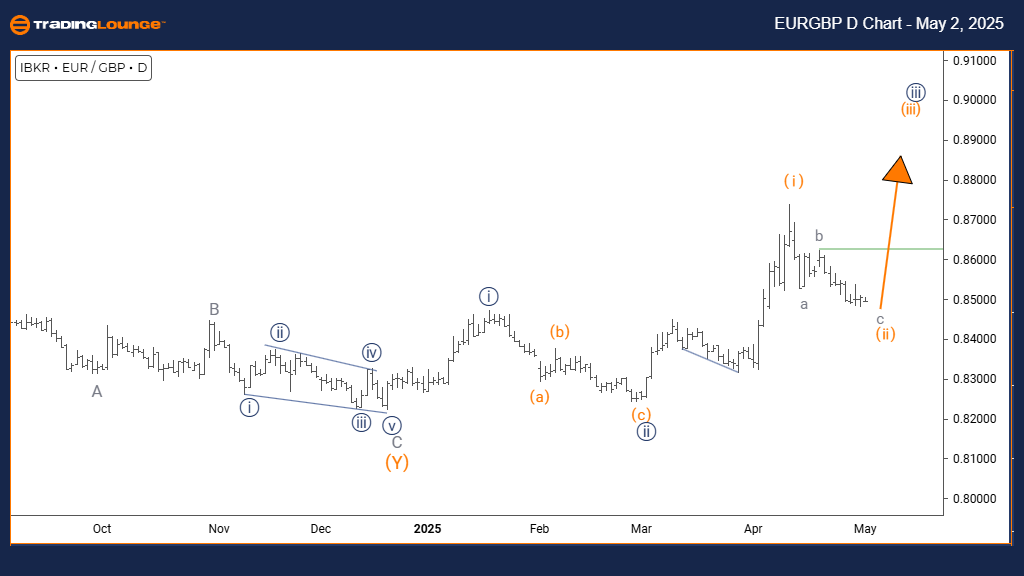
Euro/British Pound (EURGBP) Elliott Wave Analysis - TradingLounge day Chart
EURGBP Elliott Wave Technical Analysis
FUNCTION: Counter Trend
MODE: Corrective
STRUCTURE: Orange wave 2
POSITION: Navy blue wave 3
DIRECTION NEXT HIGHER DEGREES: Orange wave 3
Details:
Orange wave 1 appears completed, and orange wave 2 is now unfolding.
The EURGBP daily Elliott Wave analysis highlights a counter-trend correction forming within a broader bearish trend. Following the completion of orange wave 1's decline, the EURGBP forex pair is currently developing orange wave 2 correction inside the dominant navy blue wave 3 downtrend. This setup indicates a temporary bullish retracement before the bearish trend resumes.
Orange wave 2 serves as the corrective phase, typically retracing 38% to 61% of the preceding orange wave 1 decline, often manifesting in familiar Elliott Wave corrective patterns like zigzags or flats. The initial impulsive move down has paved the way for this pullback, which is typically marked by overlapping price action and reduced momentum. On the daily timeframe, this movement signals a medium-term pause within the prevailing bearish structure.
Once orange wave 2 concludes, a strong decline into orange wave 3 is expected. This new impulse wave is likely to be the most powerful and extended segment of the sequence, aiming to break well below the previous wave 1 low. Traders should monitor orange wave 2's development for signs of completion, such as bearish reversal candlesticks and overbought technical indicators.
This corrective phase offers strategic trading opportunities ahead of the anticipated bearish continuation. Key Fibonacci retracement levels must be closely watched to fine-tune trade entries as the transition from wave 2 to wave 3 unfolds. The EURGBP daily chart provides essential insights into the structure and timing of this critical phase in the broader Elliott Wave cycle.
Employing technical indicators and detailed price action analysis will be crucial for identifying when bullish momentum weakens and the bearish trend reasserts itself. This EURGBP Elliott Wave update suggests the forex pair may soon experience a strong move lower once the corrective phase ends.
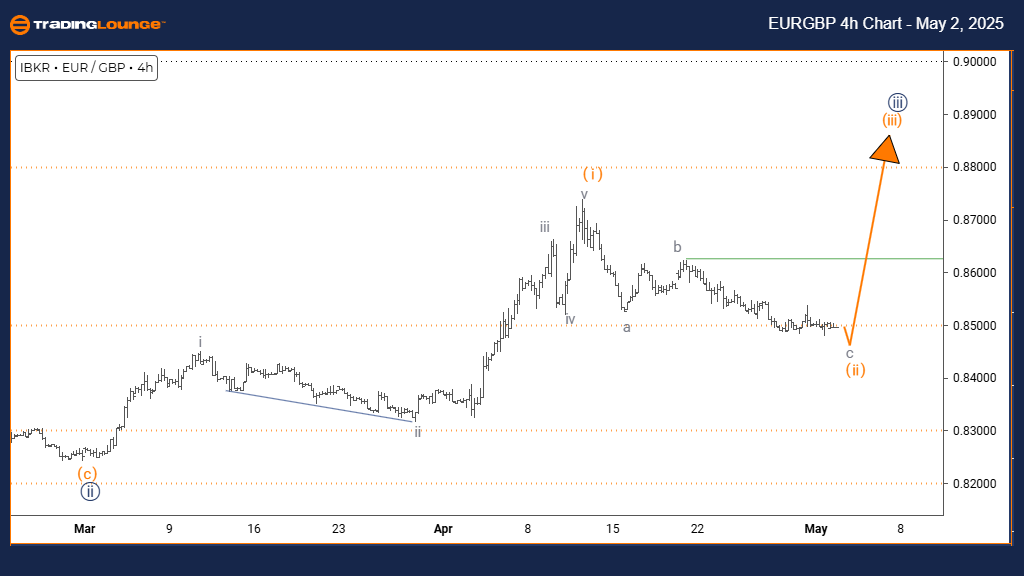
Euro/British Pound (EURGBP) Elliott Wave Analysis - TradingLounge 4-Hour Chart
EURGBP Elliott Wave Technical Analysis
FUNCTION: Counter Trend
MODE: Corrective
STRUCTURE: Orange wave 2
POSITION: Navy blue wave 3
DIRECTION NEXT HIGHER DEGREES: Orange wave 3
Details:
Orange wave 1 appears complete, and now orange wave 2 is developing.
The EURGBP 4-hour Elliott Wave technical analysis reveals a counter-trend correction progressing within a larger bearish structure. Following the decline of orange wave 1, EURGBP has transitioned into the corrective orange wave 2, contained within the broader navy blue wave 3 downtrend. This indicates a short-term bullish correction before the major bearish trend continues.
Orange wave 2 is forecasted to retrace approximately 38% to 61% of the preceding orange wave 1 movement. The earlier downward impulse created conditions ripe for this corrective phase, typically displaying overlapping price movements and weaker momentum, classic of Elliott Wave corrective structures. The 4-hour timeframe reflects that this correction could be a brief interruption within a more significant downtrend.
Upon completing orange wave 2, a new decline into orange wave 3 is anticipated. This next impulse wave should be a strong downward move, potentially breaking decisively below wave 1’s previous low. Traders are advised to watch for wave 2 completion signals, including bearish reversal candlesticks and overbought momentum readings.
This corrective wave offers traders opportunities to position for the expected decline into wave 3. Utilizing technical analysis tools like Fibonacci retracement levels will be essential for optimal entry points. The EURGBP 4-hour chart provides valuable confirmation of the broader bearish outlook once this correction concludes.
Monitoring technical indicators and closely following price action will be vital for detecting when the corrective rally ends and the downtrend resumes. This Elliott Wave forecast for EURGBP suggests that the forex pair remains poised for a substantial move lower after finalizing the current wave 2 correction.
Technical Analyst: Malik Awais
Source: Visit Tradinglounge.com and learn from the Experts. Join TradingLounge Here
Previous: GBPUSD Elliott Wave Technical Analysis
VALUE Offer - Buy 1 Month & Get 3 Months!Click here
Access 7 Analysts Over 200 Markets Covered. Chat Room With Support