08Nov

Monero/ U.S. dollar(XMRUSD) Elliott Wave Technical Analysis 8 November 23

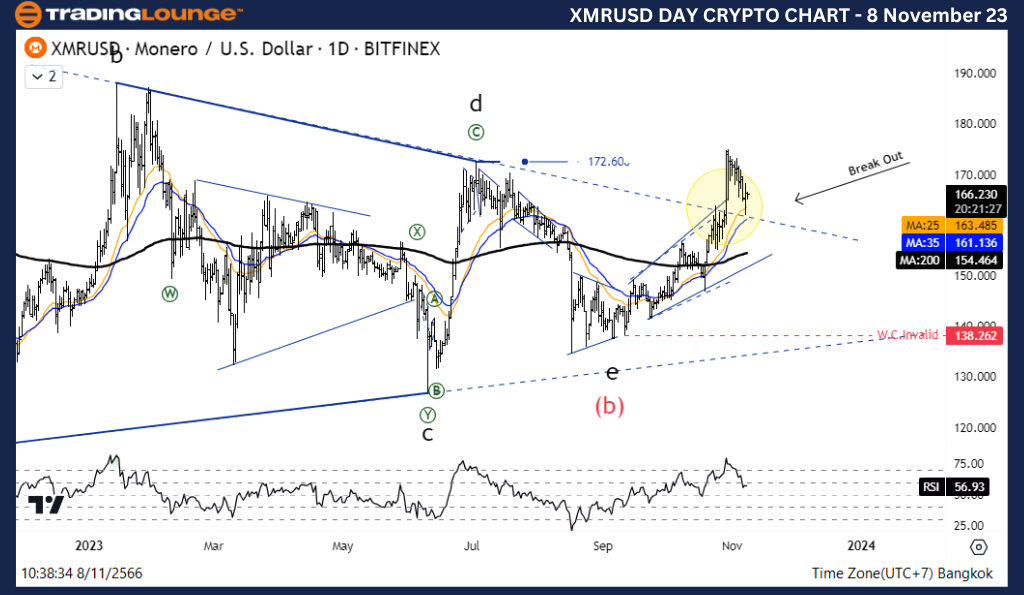
Elliott Wave Analysis TradingLounge Daily Chart,  8 November 23, 

Monero/ U.S. dollar(XMRUSD)

XMRUSD Elliott Wave Technical Analysis

Function: Counter Trend

Mode: Correvtive

Structure: Triangle

Position: Wave E

Direction Next higher Degrees: Wave (B) of Zigzag

Wave Cancel invalid Level: 138.262

Details:  Wave E may end and the price five-wave Increase in Wave (C) of Zigzag.

Monero/ U.S. dollar(XMRUSD) Trading Strategy: XRM recovered well from the 138.262 level, where the price structure can be divided into five waves in a diagonal pattern that points us to an uptrend forming. And currently the price is likely to enter a correction period. To give us another opportunity to join the trend. Waiting for the base adjustment to be completed.

Monero/ U.S. dollar(XMRUSD)Technical Indicators: The price is above the MA200 indicating an uptrend,  RSI is a Bullish  Momentum.

TradingLounge Analyst: Kittiampon Somboonsod, CEWA

Source: Tradinglounge.com get trial here!
XMRUSD-Crypto-Day-Ch...


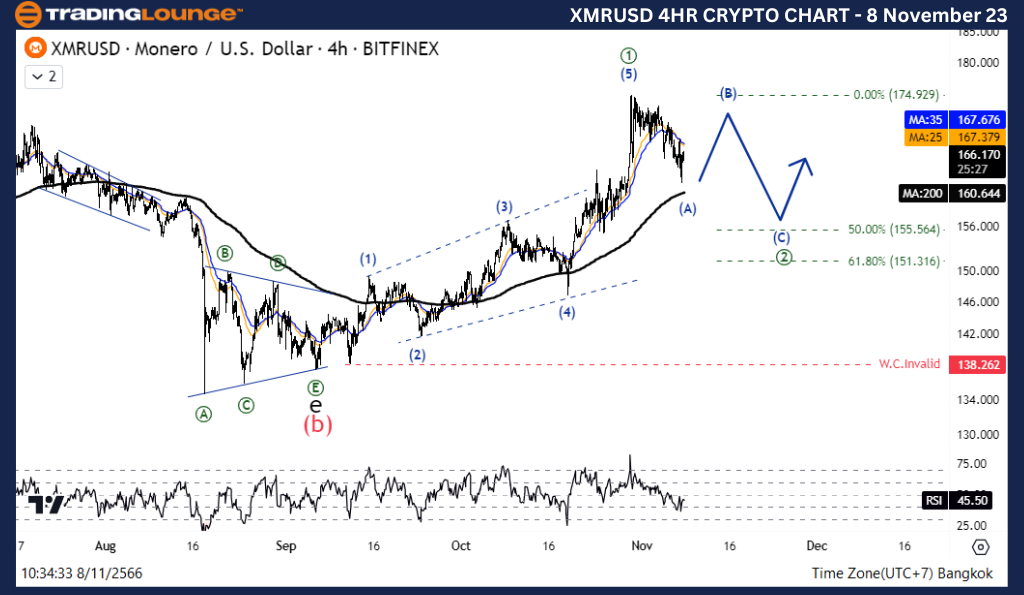
Elliott Wave Analysis TradingLounge 4H Chart, 8  November 23,  

Monero/ U.S. dollar(XMRUSD)

XMRUSD Elliott Wave Technical Analysis

Function: Counter Trend

Mode: Corrective

Structure: ……

Position: Wave ((2))

Direction Next higher Degrees: Wave ((2)) of Impulse  

Wave Cancel invalid Level: 138.262

Details:  Retracement of wave ((2)) usually .50 or .618 x Length wave ((1))

Monero/ U.S. dollar(XMRUSD)Trading Strategy: XRM recovered well from the 138.262 level, where the price structure can be divided into five waves in a diagonal pattern that points us to an uptrend forming. And currently the price is likely to enter a correction period. To give us another opportunity to join the trend. Waiting for the base adjustment to be completed.

Monero/ U.S. dollar(XMRUSD)Technical Indicators: The price is above the MA200 indicating an uptrend,  RSI is a Bullish  Momentum.
XMRUSD-Crypto-4Hr-Ch...

Related

Comprehensive Analysis of the Swiss Market Index (SMI) delves into the Elliott Wave Technical Analysis: day and weekly charts

Comprehensive Analysis of the Swiss Market Index (SMI) delves into the Elliott Wave Technical Analysis: day and weekly charts

This comprehensive analysis of the Swiss Market Index (SMI) delves into the Elliott Wave patterns on...

Read More >
Polkadot Elliott Wave Analysis Predicts Bullish DOTUSD Reversal with Wave III Setup and $4.486 Key Resistance Level Ahead

Polkadot Elliott Wave Analysis Predicts Bullish DOTUSD Reversal with Wave III Setup and $4.486 Key Resistance Level Ahead

Polkadot (DOTUSD) shows a bullish reversal after a 5-wave decline, with Elliott Wave pointing to Wav...

Read More >
AXIS BANK Elliott Wave Forecast Highlights Bullish Momentum on Daily and Weekly Charts with Key Trading Levels and Wave Setups

AXIS BANK Elliott Wave Forecast Highlights Bullish Momentum on Daily and Weekly Charts with Key Trading Levels and Wave Setups

AXIS BANK shows a bullish Elliott Wave structure with upward momentum on both daily and weekly chart...

Read More >
Boeing Stock Elliott Wave Analysis: BA Forecast, Wave Count, Chart Structure, Price Targets, and Bullish Trend Outlook Explained

Boeing Stock Elliott Wave Analysis: BA Forecast, Wave Count, Chart Structure, Price Targets, and Bullish Trend Outlook Explained

This article delivers a detailed Elliott Wave forecast for Boeing (BA), featuring both daily and int...

Read More >
Bitcoin/ U.S. dollar(BTCUSD) Elliott Wave Technical Analysis 11 December 23

Bitcoin/ U.S. dollar(BTCUSD) Elliott Wave Technical Analysis 11 December 23

Bitcoin/U.S. dollar(BTCUSD) Elliott Wave Technical Analysis dated 11 December 23 with Bitcoin and U....

Read More >
CAC 40 Elliott Wave Forecast with Daily and Weekly Chart Analysis Highlighting Corrective Wave Structure and France Stock Market

CAC 40 Elliott Wave Forecast with Daily and Weekly Chart Analysis Highlighting Corrective Wave Structure and France Stock Market

Accurate Elliott Wave forecast for the CAC 40 index with detailed daily and weekly chart analysis. U...

Read More >

Buy 1 Month

Get 3 Months!

Special Offer:

Trade Recommendations

Unleash the power of deversified trading with our comprehensive portfolio, covering:

  • Stock Trades
  • Crypto Trades
  • Forex Trades
  • Commodity Trades
Elliott Wave Analysis

Gain a competive edge with expert insights in to:

  • Global Indices
  • US Stocks & ASX Stocks
  • Forex & Crypto
  • Commodities
Top-Notch Trading Tools

Equip yourself with the tools of success:

  • Social Chat
  • Elliott Wave Algorithm
  • Screener
  • TradingLevels
  • Trading Game
7 Elliott Wave Analysts

Stay ahead of the market with daily charts and insightful videos
-Your secret to strategic trading!

JOIN HERE


Welcome to TradingLounge (ASIC A.R.No. 321187), specialists in trades, trading education and technical analysis, covering stocks, indices, commodities, forex and cryptocurrencies.

When you join TradingLounge you have access to everything we offer, including trade tools, educational content and a social platform to chat with like-minded investors.

Read more

@Copyright 2024 by tradinglounge.com

Contact Us

Australian no: 02 4787 6020

International no: +61 (2) 47876020

Pay with:

Find us on