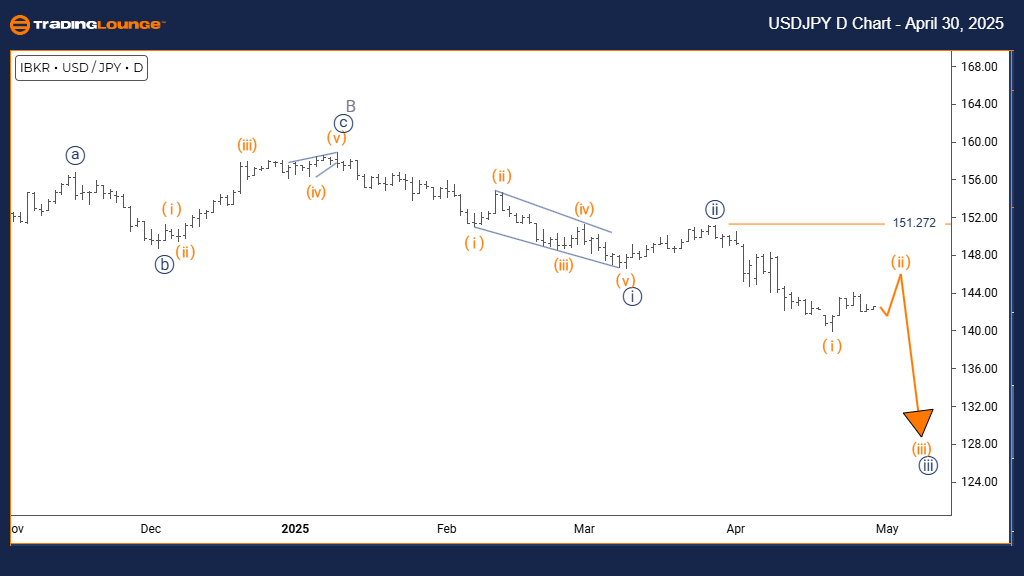
U.S. Dollar / Japanese Yen (USDJPY) – Trading Lounge Day Chart
USDJPY Elliott Wave Technical Analysis
FUNCTION: Counter Trend
MODE: Corrective
STRUCTURE: Orange Wave 2
POSITION: Navy Blue Wave 3
DIRECTION NEXT LOWER DEGREES: Orange Wave 3
DETAILS: Completion of orange wave 1 appears done. Now, orange wave 2 is active.
Wave Cancel/Invalid Level: 151.272
The daily USDJPY Elliott Wave analysis highlights a corrective phase within a broader bullish trend. The recent completion of orange wave 1 has initiated orange wave 2, a classic retracement pattern within the larger navy blue wave 3 uptrend. This correction suggests a temporary price dip before a potential continuation of the upward trend.
Orange wave 2 is unfolding as a typical corrective wave, likely retracing between 38.2% and 61.8% of wave 1’s advance. This structure often forms as a zigzag or flat, featuring slower momentum and overlapping price action. These characteristics align with a corrective pattern, indicating a consolidation before a stronger bullish move.
The anticipated next phase is orange wave 3, expected to start once wave 2 completes. Historically, wave 3 tends to be the most powerful leg in Elliott Wave patterns, with potential to break above the wave 1 peak. Traders should monitor 151.272 as the critical invalidation level—any sustained move below this point would challenge the current bullish wave count.
Key technical indicators such as bullish candlestick formations, momentum oscillators turning from oversold, and increased volume can signal the end of wave 2. This corrective stage offers traders an opportunity to prepare for the next upward impulse. Observing Fibonacci support zones will assist in identifying favorable entry points for the potential wave 3 breakout.
In summary, this corrective pullback in USDJPY is part of a healthy uptrend continuation, offering strategic positioning opportunities before the likely rally resumes.
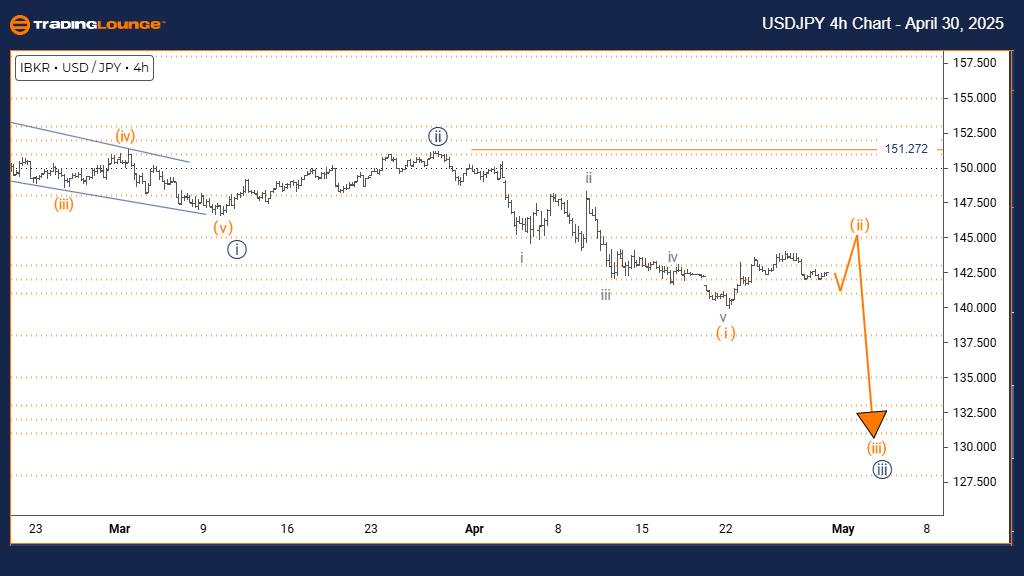
U.S. Dollar / Japanese Yen (USDJPY) – Trading Lounge 4 Hour Chart
USDJPY Elliott Wave Technical Analysis
FUNCTION: Counter Trend
MODE: Corrective
STRUCTURE: Orange Wave 2
POSITION: Navy Blue Wave 3
DIRECTION NEXT LOWER DEGREES: Orange Wave 3
DETAILS: Orange wave 1 seems completed; orange wave 2 is underway.
Wave Cancel/Invalid Level: 151.272
The 4-hour USDJPY Elliott Wave chart indicates an active correction within a larger bullish formation. Following the completion of orange wave 1, orange wave 2 is now progressing, developing inside the broader navy blue wave 3 structure. This short-term retracement signals a pause before the dominant trend resumes higher.
Wave 2 corrections typically retrace between 38% and 61% of wave 1, often marked by sideways or overlapping price action. This corrective behavior is evident in the current structure, suggesting temporary weakness that aligns with a bullish setup.
The next expected leg is orange wave 3, which may deliver a strong price rally exceeding the previous wave 1 peak. The 151.272 level remains the key invalidation point—if breached, a reassessment of the wave count will be necessary.
Traders should watch for signals marking the end of wave 2, including bullish reversal candles, divergence in momentum indicators, and signs of increased buying volume. These clues help confirm the transition to a new bullish impulse wave.
This phase should be seen as a standard consolidation within a rising market. It provides an opportunity to align with the prevailing trend. Monitoring Fibonacci retracement zones and technical confluence levels will help in timing entries as the market prepares to shift from wave 2 to wave 3.
Technical Analyst: Malik Awais
Source: Visit Tradinglounge.com and learn from the Experts. Join TradingLounge Here
Previous: EURUSD Elliott Wave Technical Analysis
VALUE Offer - Buy 1 Month & Get 3 Months!Click here
Access 7 Analysts Over 200 Markets Covered. Chat Room With Support