BA Elliott Wave Technical Analysis: The Boeing Company (BA) – Daily & 1H Chart Breakdown
This Elliott Wave analysis of The Boeing Company (BA) provides insights into both the daily and 1-hour chart structures, outlining the ongoing trends and potential price movements.
BA Elliott Wave Analysis – TradingLounge Daily Chart
The Boeing Company (BA) Daily Chart Overview
BA Stock Technical Analysis
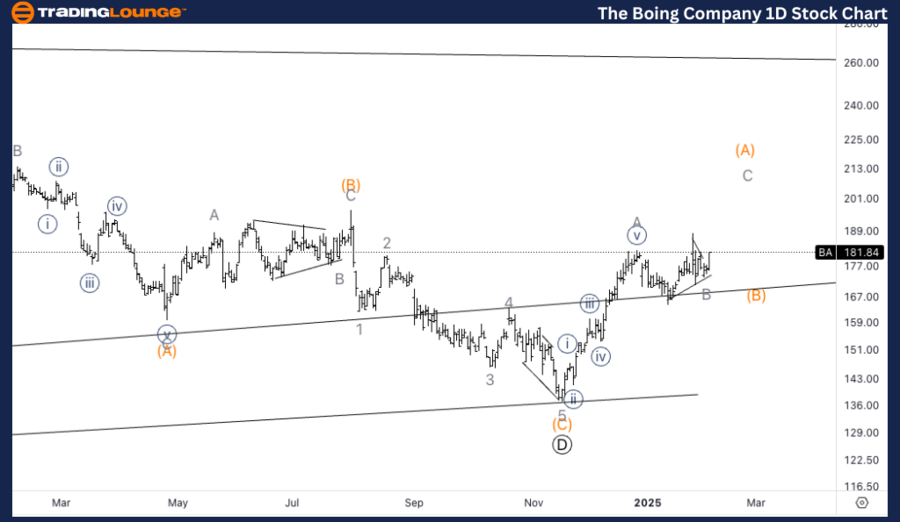
- Function: Counter Trend
- Mode: Corrective
- Structure: Triangle
- Position: Wave (A) of E
- Direction: Upside in wave C of (A).
- Target: $200
The Boeing Company Share Technical Analysis – Daily Chart
The Boeing Company (BA) is currently unfolding in a corrective triangle pattern, specifically in wave (A) of E. We anticipate an upward movement into wave C of (A), with an alternative scenario suggesting that it could be wave (C) of E, which is one degree higher.
Key price action levels indicate a potential upside target near Trading Level 2 at $200. As the stock approaches this resistance, traders should watch for signals confirming the completion of wave (A) or a more extended bullish correction.
This technical setup suggests an opportunity for traders looking for trend continuation signals within the Elliott Wave framework.
BA Elliott Wave Analysis – TradingLounge 1-Hour Chart
The Boeing Company (BA) 1H Chart Overview
BA Elliott Wave Technical Analysis
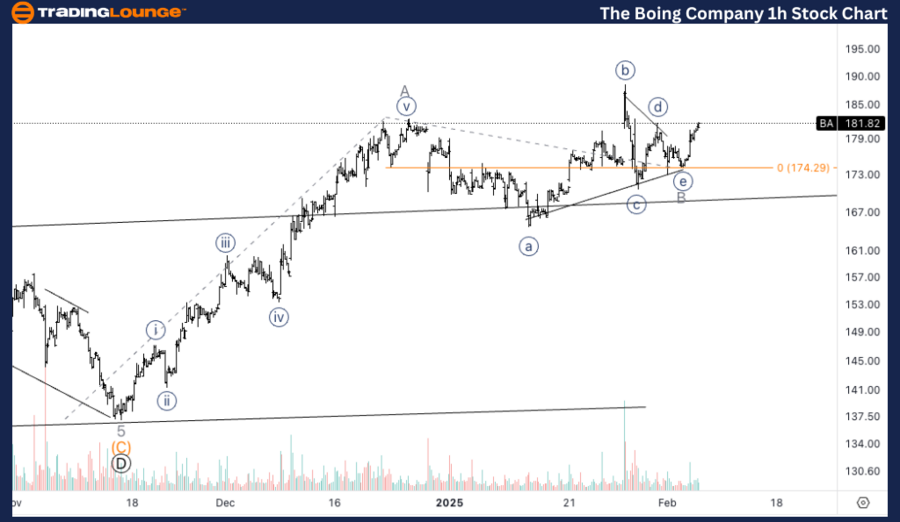
- Function: Counter Trend
- Mode: Corrective
- Structure: Triangle
- Position: Wave B of (A)
- Direction: Upside in wave C
- Target: $200
BA Share Technical Analysis – 1H Chart
On the 1-hour chart, BA appears to have completed a triangle formation in wave B of (A). The current wave C is expected to push higher, indicating further upside potential.
One key technical indicator supporting this movement is increasing volume at the bottom of wave B, suggesting that a low may already be in place. If momentum continues to build, a breakout targeting $200 as a minimum upside objective would confirm the expected wave C movement.
Traders should closely monitor price action, volume spikes, and key resistance levels to validate this Elliott Wave setup and assess whether the corrective structure extends further.
Technical Analyst: Alessio Barretta
Source: visit Tradinglounge.com and learn From the Experts Join TradingLounge Here
See Previous: SMCI Elliott Wave Technical Analysis
VALUE Offer - Buy 1 Month & Get 3 Months!Click here
Access 7 Analysts Over 200 Markets Covered. Chat Room With Support
Key Takeaways from BA Elliott Wave Analysis