Goodman Group – GMG Elliott Wave Analysis TradingLounge 1D Chart

Greetings, today's Elliott Wave update covers the Australian Stock Exchange (ASX) with a focus on Goodman Group (GMG). Our analysis indicates GMG is poised for a short-term rise, aligning with the development of a grey v-wave.

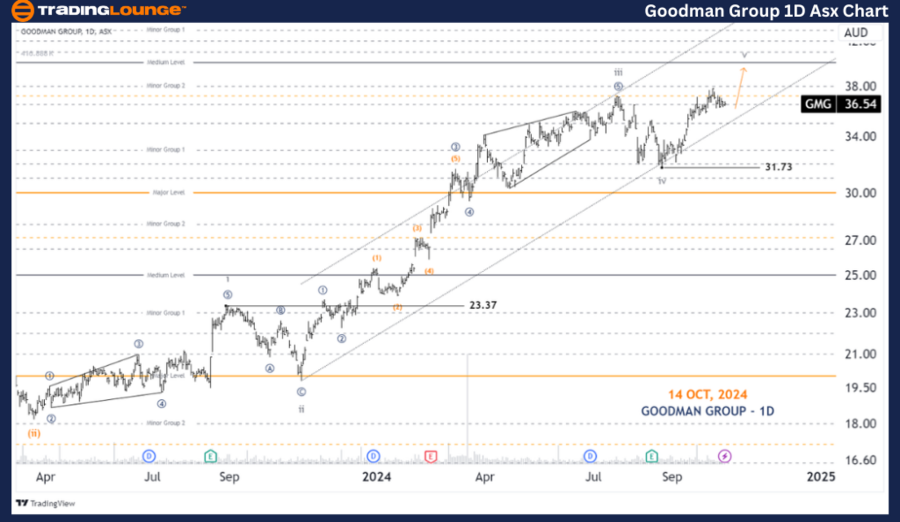
ASX: GOODMAN GROUP (GMG) 1D Chart Analysis (Semilog Scale)

GMG Elliott Wave Technical Analysis

Trend Function: Major trend (Minute degree, navy)

Wave Mode: Motive

Wave Structure: Impulse

Current Position: Wave v-grey of Wave (iii)-orange of Wave ((iii))-navy

Details:

  • Wave iv-grey has concluded, and wave v-grey is now forming with a bullish push higher. The price targets are between 38.00 and 40.00, which will be explored further in our 4-hour chart analysis.
  • Invalidation Point: 31.73

GOODMAN-GROUP-1d-asx...


GMG Elliott Wave Analysis TradingLounge 4-Hour Chart

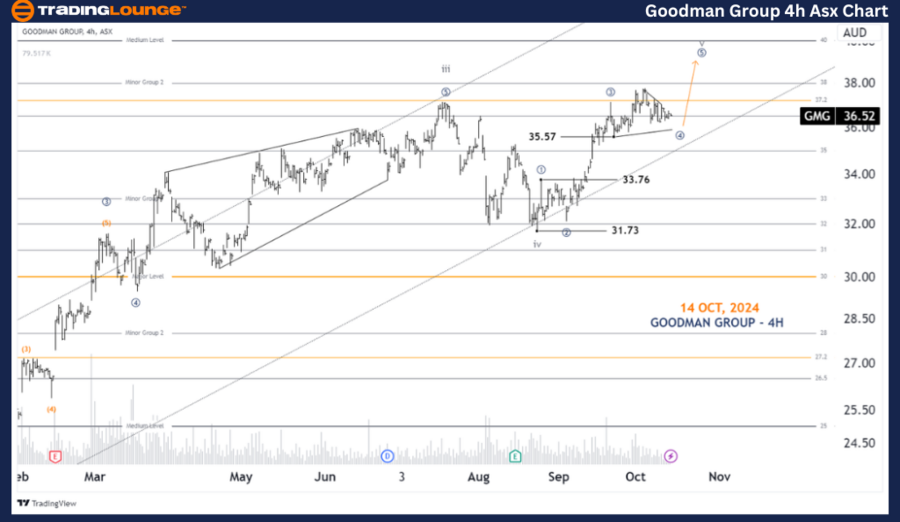
ASX: GOODMAN GROUP (GMG) 4-Hour Chart Analysis

Trend Function: Major trend (Subminuette degree, grey)

Wave Mode: Motive

Wave Structure: Impulse

Current Position: Wave ((4))-navy of Wave ((5))-navy

Details:

  • Wave ((3))-navy appears to have completed, and wave ((4))-navy is unfolding as a Triangle. Once the triangle formation concludes, the trend is expected to resume with wave ((5))-navy, targeting the 38.00 - 40.00 range.
  • The triangle remains valid as long as the price stays above 35.57.

Invalidation Point: 33.76

Technical Analyst: Hua (Shane) Cuong, CEWA-M (Master’s Designation).

Source: visit Tradinglounge.com and learn From the Experts Join TradingLounge Here 

See Previous: Commonwealth Bank of Australia Elliott Wave Technical Analysis

VALUE Offer - Buy 1 Month & Get 3 Months!Click here

Access 7 Analysts Over 200 Markets Covered. Chat Room With Support

GOODMAN-GROUP-4h-asx...


Conclusion

Our Elliott Wave forecast for ASX: Goodman Group (GMG) outlines key trends and price movements. This analysis offers actionable insights, empowering traders to better understand how to navigate the current wave cycles. Key validation and invalidation points are included to reinforce our perspective, providing clarity on when specific wave counts are either confirmed or voided. With this detailed view, we strive to equip readers with the most professional and objective market outlook to support informed trading decisions.

Related

Ultratech Cement Elliott Wave Analysis: Stock Forecast Predicts Bullish Breakout After Current Correction on Daily and Weekly Charts

Ultratech Cement Elliott Wave Analysis: Stock Forecast Predicts Bullish Breakout After Current Correction on Daily and Weekly Charts

ULTRATECH CEMENT is in a corrective phase within a broader bullish trend. After the current correcti...

Read More >
British Pound/Japanese Yen(GBPJPY) Elliott Wave Technical Analysis 16 January 24

British Pound/Japanese Yen(GBPJPY) Elliott Wave Technical Analysis 16 January 24

In summary, the GBPJPY Elliott Wave Analysis for the daily chart on 16 January 24, suggests that the...

Read More >
Expert Forecasts, Technical Indicators, and Market Insights: Uniswap Crypto Price News Today Elliott Wave Technical Analysis

Expert Forecasts, Technical Indicators, and Market Insights: Uniswap Crypto Price News Today Elliott Wave Technical Analysis

Explore detailed Uniswap (UNIUSD) Elliott Wave analysis with insights into price predictions and mar...

Read More >
AAPL, AMZN, NVDA, TSLA, GOOGL, META, NFLX, MSFT, Elliott Wave Trend Analysis

AAPL, AMZN, NVDA, TSLA, GOOGL, META, NFLX, MSFT, Elliott Wave Trend Analysis

The recent Elliott Wave analysis of the NASDAQ Stock Market suggests a positive outlook, with Friday...

Read More >
Gold Elliott Wave Analysis March 2025: Price Forecast, Fibonacci Support Zones, Bullish Trend Continuation, and Trade Opportunities

Gold Elliott Wave Analysis March 2025: Price Forecast, Fibonacci Support Zones, Bullish Trend Continuation, and Trade Opportunities

Gold Elliott Wave analysis highlights the current bullish wave count, focusing on wave (3) and poten...

Read More >
S&P/TSX 60 Elliott Wave Analysis Shows Bullish Trend Developing With Strong Impulsive Structure and Upward Market Momentum

S&P/TSX 60 Elliott Wave Analysis Shows Bullish Trend Developing With Strong Impulsive Structure and Upward Market Momentum

S&P/TSX 60 Elliott Wave forecast highlights an ongoing bullish trend marked by impulsive wave struct...

Read More >

$1 for 2 Weeks

then $29 a month!

What a Special Offer!

Trade Recommendations

Unleash the power of deversified trading with our comprehensive portfolio, covering 250+ markets:

  • Stock Trades
  • Crypto Trades
  • Forex Trades
  • Commodity Trades
Elliott Wave Analysis

Gain a competitive edge with expert insights and AI-powered Elliott Wave charting into:

  • Global Indices
  • US Stocks & ASX Stocks
  • Forex & Crypto
  • Commodities
Top-Notch Trading Tools

Equip yourself with the tools of success:

  • Real-time Chat rooms
  • Elliott Wave Algorithm
  • Portfolio tools
  • TradingLevels
  • Screener
  • Trading Game
7 Elliott Wave Analysts

Stay ahead of the market with daily charts and insightful videos
Your secret to strategic trading!

JOIN HERE


Welcome to TradingLounge (ASIC A.R.No. 321187), specialists in trades, trading education and technical analysis, covering stocks, indices, commodities, forex and cryptocurrencies.

When you join TradingLounge you have access to everything we offer, including trade tools, educational content and a social platform to chat with like-minded investors.

Read more

@Copyright 2024 by tradinglounge.com

Contact Us

Australian no: 02 4787 6020

International no: +61 (2) 47876020

Pay with:

Find us on