Commonwealth Bank of Australia (CBA) – TradingLounge 1D Chart

Greetings, today’s Elliott Wave analysis focuses on the Australian Stock Exchange (ASX) with an update on Commonwealth Bank of Australia (CBA). According to our analysis, CBA is poised to enter wave 5, which could push the stock higher, although more time is needed to complete wave 4.

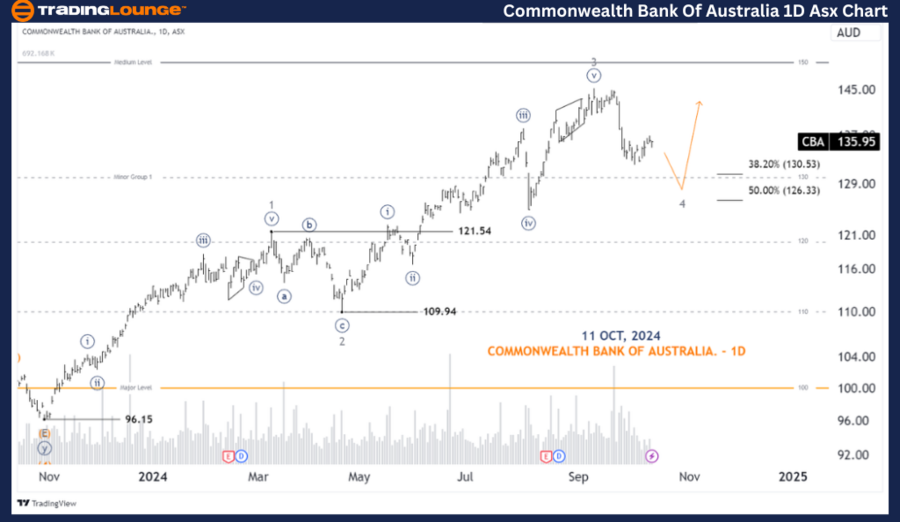
ASX: Commonwealth Bank of Australia – CBA 1D Chart (Semilog Scale) Analysis

CBA Elliott Wave Technical Analysis

Function: Major Trend (Minor Degree, Grey)

Mode: Motive

Structure: Impulse

Position: Wave 4-Grey

Details: Wave 3-Grey has concluded as a five-wave structure, and Wave 4-Grey is currently unfolding, which may push the price lower. The potential target for this decline could be near the 130.53 area. After completing this move, Wave 5-Grey could emerge, pushing the stock higher again. Further analysis will be conducted on the 4-hour chart for a more detailed outlook.

Invalidation Point: 121.54

Commonwealth-Bank-Of...


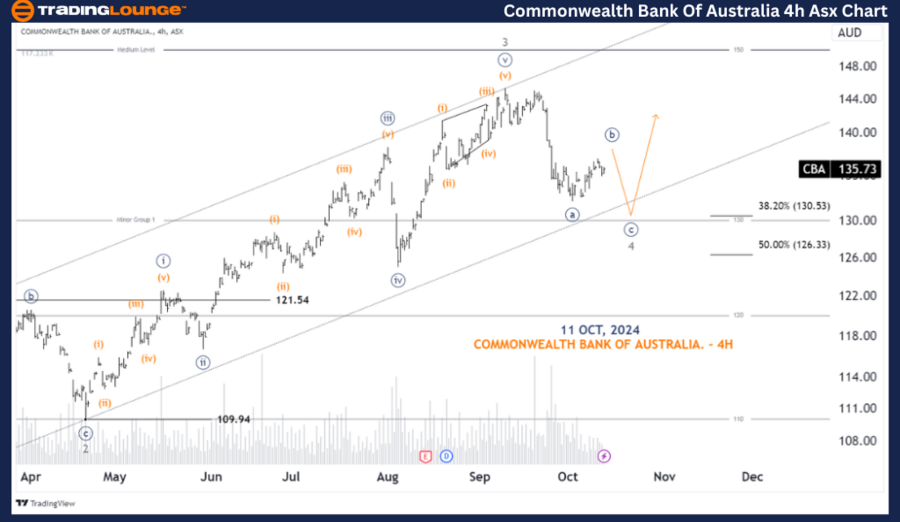
ASX: Commonwealth Bank of Australia – CBA 4-Hour Chart Analysis

Function: Major Trend (Minute Degree, Navy)

Mode: Motive

Structure: Impulse

Position: Wave ((c))-Navy of Wave 4-Grey

Details: We see further detail in Wave 4-Grey, which may have one more push lower to meet its target. In the near term, a potential push higher with Wave ((b)) or Wave 5-Grey is anticipated. We’ll assess whether this upward movement is strong enough to be considered as Wave 5-Grey or if it’s just Wave ((b))-Navy, indicating a possible lower leg to follow.

Invalidation Point: 121.54

Technical Analyst: Hua (Shane) Cuong, CEWA-M (Master’s Designation).

Source: visit Tradinglounge.com and learn From the Experts Join TradingLounge Here 

See Previous: CAR GROUP LIMITED - CAR Elliott Wave Technical Analysis

VALUE Offer - Buy 1 Month & Get 3 Months!Click here

Access 7 Analysts Over 200 Markets Covered. Chat Room With Support

Commonwealth-Bank-Of...


Conclusion:

Our analysis of the Commonwealth Bank of Australia (CBA) on the ASX provides insights into current market trends, emphasizing how traders can take advantage of these movements. The outlined price points serve as key validation and invalidation markers for the wave count, boosting confidence in our forecast. By integrating these elements, we aim to deliver an objective and professional assessment of the market trends for CBA.

Related

SEIUSD Elliott Wave Overview: Daily & H4 Chart Guide – Wave 2 Correction, $0.220 Breakout, Fibonacci Setup, Swing‑Trade Strategy

SEIUSD Elliott Wave Overview: Daily & H4 Chart Guide – Wave 2 Correction, $0.220 Breakout, Fibonacci Setup, Swing‑Trade Strategy

This article provides an in‑depth Elliott Wave analysis for SEI/USD on both Daily and H4 charts. It...

Read More >
NEOUSD Elliott Wave Analysis: NEO Price Prediction, Breakout Levels, Fibonacci Support, and Market Trends for Crypto Investors

NEOUSD Elliott Wave Analysis: NEO Price Prediction, Breakout Levels, Fibonacci Support, and Market Trends for Crypto Investors

NEOUSD Elliott Wave analysis, covering NEO price predictions, trading strategies, and key resistance...

Read More >
Cardano (ADAUSD) Elliott Wave Analysis: Fibonacci Support, and Bullish Trading Strategy for Swing Traders and Crypto Investors

Cardano (ADAUSD) Elliott Wave Analysis: Fibonacci Support, and Bullish Trading Strategy for Swing Traders and Crypto Investors

Elliott Wave analysis of Cardano (ADA/USD), highlighting the current corrective phase in Wave II. It...

Read More >
Tech Mahindra Elliott Wave Analysis: Daily and Weekly Chart Breakdown, Wave Count Strategy, and Price Prediction Insights

Tech Mahindra Elliott Wave Analysis: Daily and Weekly Chart Breakdown, Wave Count Strategy, and Price Prediction Insights

Elliott Wave analysis of Tech Mahindra, covering both daily and weekly chart perspectives. It highli...

Read More >
ASX:IAG Elliott Wave Analysis, Stock Forecast, Price Trends, Wave Patterns, Market Insights, and Trading Strategies for Investors

ASX:IAG Elliott Wave Analysis, Stock Forecast, Price Trends, Wave Patterns, Market Insights, and Trading Strategies for Investors

Get the latest ASX:IAG Elliott Wave analysis and stock forecast. Learn how wave patterns influence I...

Read More >
Coffee Price Forecast Using Elliott Wave Analysis: Triangle Structure, Market Outlook, and Technical Trading Strategy Explained

Coffee Price Forecast Using Elliott Wave Analysis: Triangle Structure, Market Outlook, and Technical Trading Strategy Explained

Coffee price movements using Elliott Wave theory. It highlights the current triangle formation, fore...

Read More >

$1 for 2 Weeks

then $29 a month!

What a Special Offer!

Trade Recommendations

Unleash the power of deversified trading with our comprehensive portfolio, covering 250+ markets:

  • Stock Trades
  • Crypto Trades
  • Forex Trades
  • Commodity Trades
Elliott Wave Analysis

Gain a competitive edge with expert insights and AI-powered Elliott Wave charting into:

  • Global Indices
  • US Stocks & ASX Stocks
  • Forex & Crypto
  • Commodities
Top-Notch Trading Tools

Equip yourself with the tools of success:

  • Real-time Chat rooms
  • Elliott Wave Algorithm
  • Portfolio tools
  • TradingLevels
  • Screener
  • Trading Game
7 Elliott Wave Analysts

Stay ahead of the market with daily charts and insightful videos
Your secret to strategic trading!

JOIN HERE


Welcome to TradingLounge (ASIC A.R.No. 321187), specialists in trades, trading education and technical analysis, covering stocks, indices, commodities, forex and cryptocurrencies.

When you join TradingLounge you have access to everything we offer, including trade tools, educational content and a social platform to chat with like-minded investors.

Read more

@Copyright 2024 by tradinglounge.com

Contact Us

Australian no: 02 4787 6020

International no: +61 (2) 47876020

Pay with:

Find us on