Coffee Elliott Wave Analysis – Trading Lounge
Coffee prices are currently experiencing a short-term pullback after the upward surge that began in April 2025. Despite the correction, the commodity remains within a strong long-term bullish trend. The retracement, which started on April 29, could be forming a new entry point for buyers. As long as the key support level at 323.9 holds firm, further upward movement remains the most probable scenario.
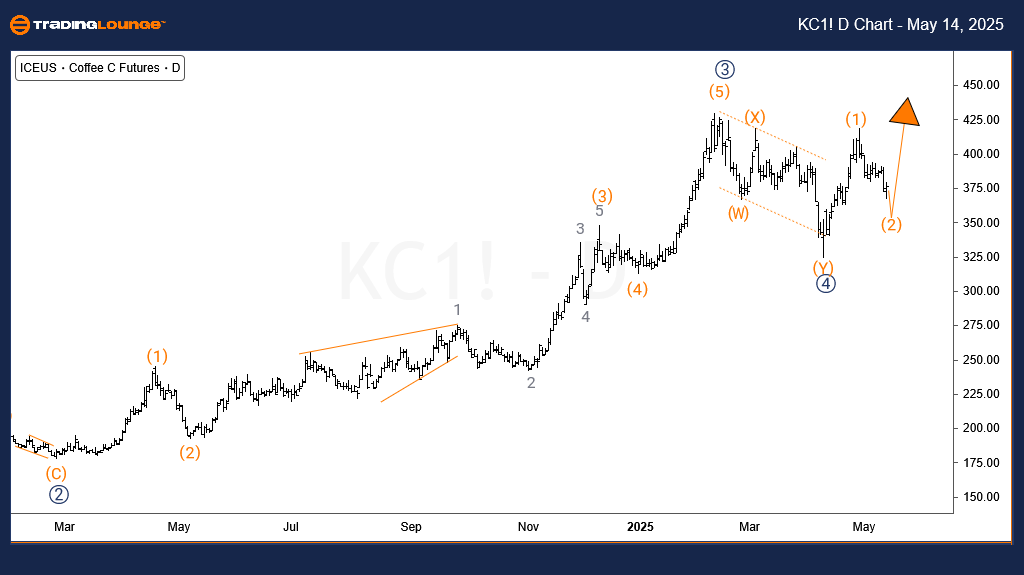
Coffee Elliott Wave Analysis – Daily Chart
The daily timeframe highlights a bullish Elliott Wave structure that began in January 2023. In this ongoing uptrend, primary waves I and II have been completed, with wave III now in progress. Within this third wave, sub-waves ((1)) to ((4)) have already formed, and the market is advancing into sub-wave ((5)).
Starting from the low in April 2025, wave ((5)) initiated with sub-wave (1), which concluded on April 29. The current correction is identified as sub-wave (2) of ((5)). While this wave may dip slightly lower, it is expected to lead into a continuation higher through wave (3), sustaining the bullish momentum.
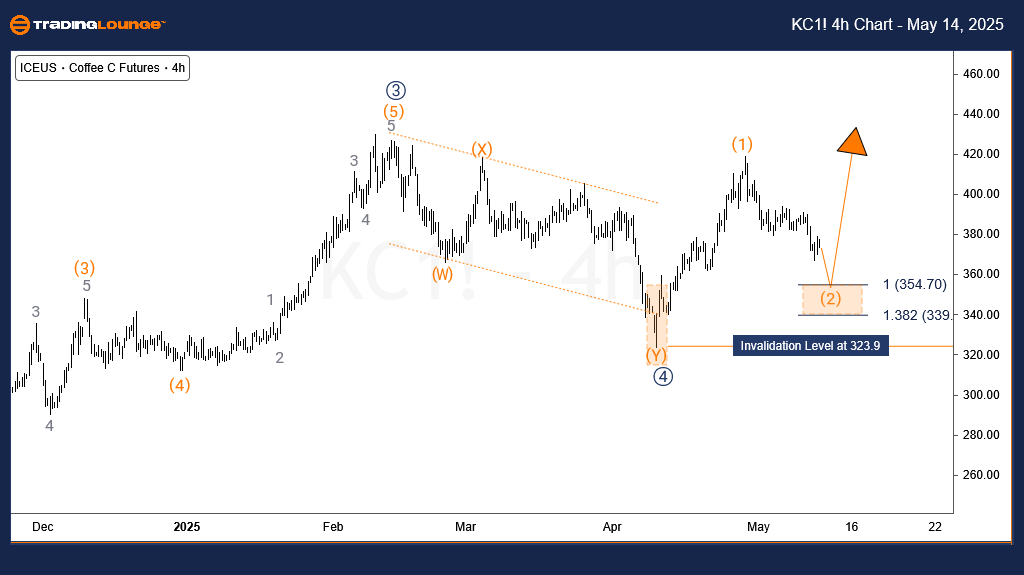
Coffee Elliott Wave Analysis – H4 Chart
The 4-hour chart illustrates the unfolding of wave (2), which may extend into the 354 to 339 price range. This zone is a potential support area where wave (2) could finalize, initiating the next upward leg in wave (3). Traders should monitor this zone for bullish reversal patterns or a breakout above the top of wave (1) as confirmation. Maintaining the 323.9 support level is critical to preserving the bullish Elliott Wave outlook for coffee.
Technical Analyst: Sanmi Adeagbo
Source: Visit Tradinglounge.com and learn from the Experts. Join TradingLounge Here
See Previous: Natural Gas Elliott Wave Technical Analysis
VALUE Offer - Buy 1 Month & Get 3 Months!Click here
Access 7 Analysts Over 200 Markets Covered. Chat Room With Support