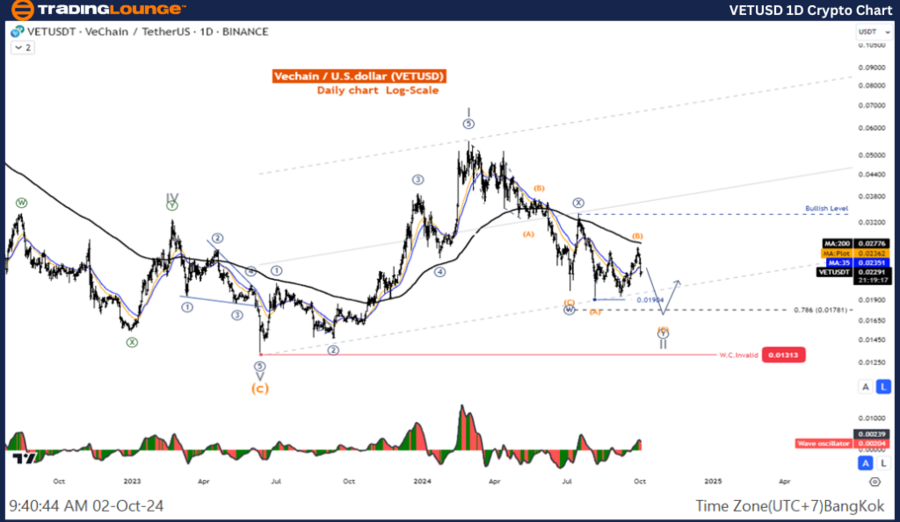
VETUSD Elliott Wave Analysis – TradingLounge Daily Chart
VeChain/ U.S. Dollar (VETUSD) Chart Technical Analysis
VETUSD Elliott Wave Technical Analysis
Function: Counter Trend
Mode: Corrective
Structure: Double Corrective
Position: Wave ((Y))
Direction of Next Higher Degrees: Wave II of Impulse
Wave Cancel Invalid Level: N/A
Details: Wave II may not yet be complete; the price is likely to remain below 0.01781.
VeChain/ U.S. Dollar (VETUSD) Trading Strategy
The price movement from 0.01904 appears corrective, indicating that the overall correction may not be over. Traders should watch for a potential retracement below 0.01904.
VeChain/ U.S. Dollar (VETUSD) Technical Indicators

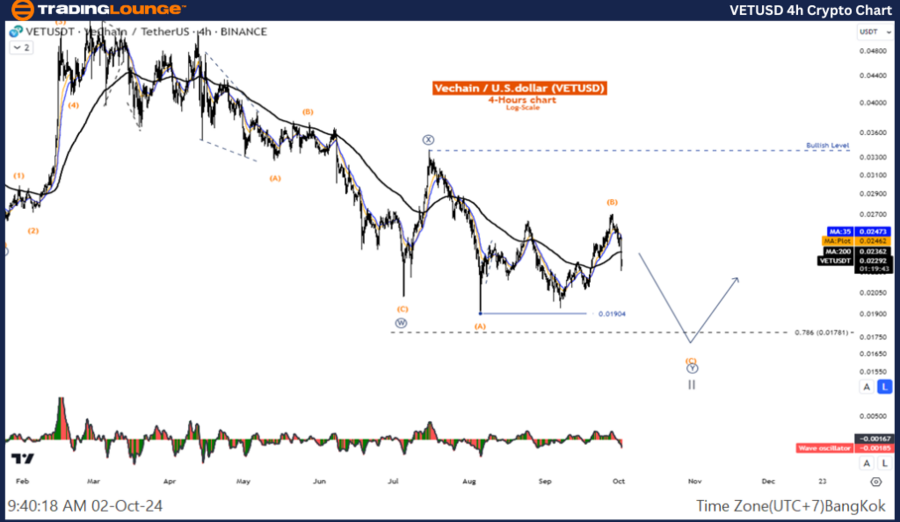
VeChain/ U.S. Dollar (VETUSD) – 4-Hour Chart
VETUSD Elliott Wave Technical Analysis
Function: Counter Trend
Mode: Corrective
Structure: Double Corrective
Position: Wave ((Y))
Direction of Next Higher Degrees: Wave II of Impulse
Wave Cancel Invalid Level: N/A
Details: Wave II may not yet be complete; the price is likely to stay below 0.01781.
VeChain/ U.S. Dollar (VETUSD) Trading Strategy
The rise from 0.01904 has a corrective structure, which suggests that the correction phase might not be concluded. Traders should remain alert for a potential retracement below 0.01904.
VeChain/ U.S. Dollar (VETUSD) Technical Indicators
Technical Analyst: Kittiampon Somboonsod
Source: visit Tradinglounge.com and learn From the Experts Join TradingLounge Here
See Previous: Bitcoin/ U.S. Dollar (BTCUSD) Elliott Wave Technical Analysis
VALUE Offer - Buy 1 Month & Get 3 Months!Click here
Access 7 Analysts Over 200 Markets Covered. Chat Room With Support
