29May

NextEra Energy Inc.(NEE) Stocks Elliott Wave Technical Analysis: Covers Stock Predictions, Technical insights, And wave pattern analysis

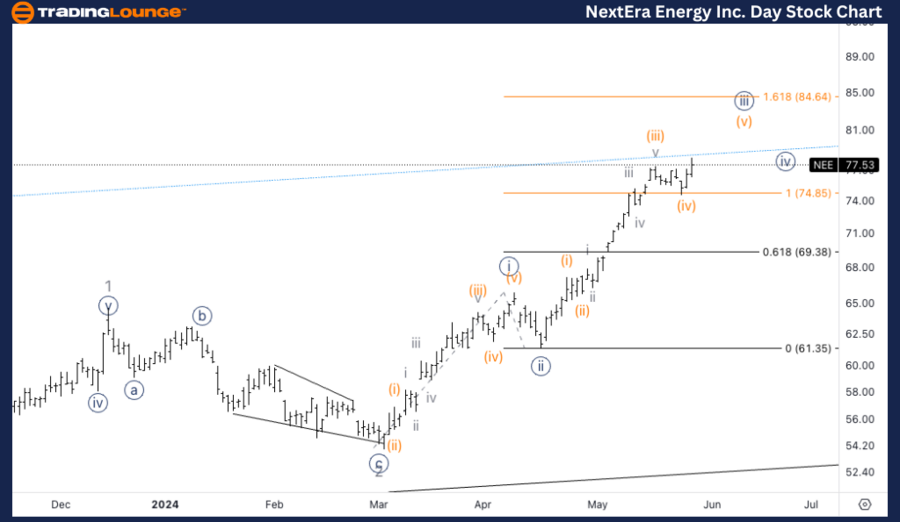
NEE Elliott Wave Analysis Trading Lounge Daily Chart,

NEE Elliott Wave Analysis: Daily Chart Analysis

NEE Elliott Wave Technical Analysis

Trend: Impulsive

Structure: Motive

Position: Minor 3

Direction: Top in 3

Overview:

In the daily chart of NextEra Energy Inc. (NEE), the Elliott Wave analysis indicates an impulsive trend, suggesting a strong and clear directional move. The structure is classified as motive, which is typical for impulsive waves. Currently, the position is in Minor wave 3, with a directional focus on the top in wave 3.

Analysis Details:

Wave 2 Completion: The analysis is looking for the completion of a three-wave corrective move in wave 2. This will set the stage for the continuation of the upward trend.

Minor Wave 3: Expecting Minor wave 3 to continue unfolding in a clear five-wave pattern. This is a characteristic of Elliott's motive wave structure, indicating a strong bullish trend.

Resistance Levels: The next significant resistance level is anticipated at TL8, approximately $80. This level will be crucial to watch as it could determine the next phase of the price movement.

NextEra-Energy-Inc-1...


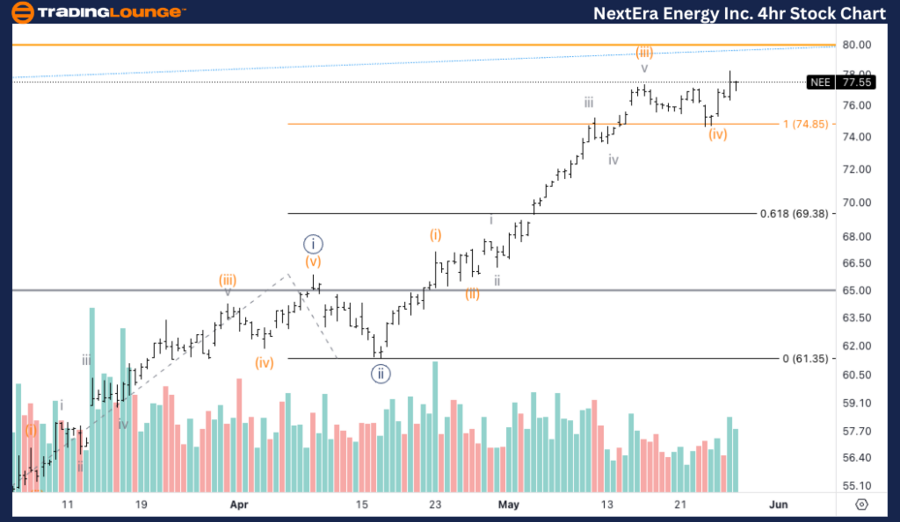
NEE Elliott Wave Analysis Trading Lounge 4Hr Chart,

NextEra Energy Inc., (NEE) 4Hr Chart Analysis

NEE Elliott Wave Technical Analysis

Trend: Impulsive

Structure: Motive

Position: Wave (v) of {iii}

Direction: Upside in (v)

Overview:

The 4-hour chart provides a closer look at the ongoing impulsive trend. The structure remains motive, aligning with the larger daily trend analysis. The position is identified as wave (v) of {iii}, indicating that the bullish wave is in its final stages within this specific timeframe.

Analysis Details:

Wave (v) Development: The focus is on the upward movement into wave (v). This wave is critical as it completes the larger wave {iii}.

Volume Confirmation: The bullish move is supported by volume analysis, which confirms the strength of the upward trend.

Equality of Waves: The price has already surpassed the equality of wave {iii} vs. wave {i} at $75. This milestone is significant as it validates the strength of wave {iii}.

Key Fibonacci Level: The 1.618 Fibonacci extension stands at $84. This level is important for projecting the potential reach of wave (v) and serves as a significant resistance point.

Technical Analyst: Alessio Barretta

Source: visit Tradinglounge.com and learn From the Experts Join TradingLounge Here 

See Previous:The Home Depot, (HD) Stocks Elliott Wave Technical Analysis

Special Trial Offer - 0.76 Cents a Day for 3 Months! Click here

Access 7 Analysts Over 170 Markets Covered. Chat Room With Support

NextEra-Energy-Inc-4...

Conclusion:

NextEra Energy Inc. (NEE) is currently exhibiting a strong impulsive trend as per the Elliott Wave analysis on both daily and 4-hour charts. In the daily chart, the completion of wave 2 will pave the way for further bullish movement in Minor wave 3, targeting the $80 resistance level. On the 4-hour chart, wave (v) of {iii} is in progress, with a crucial Fibonacci extension target at $84. Investors and traders should closely monitor these resistance levels and volume confirmations to gauge the continuation of the bullish trend.

Related

Unlocking ASX Trading Success: BLOCK INC. - SQ2 Stock Analysis & Elliott Wave Technical Forecast

Unlocking ASX Trading Success: BLOCK INC. - SQ2 Stock Analysis & Elliott Wave Technical Forecast

Our comprehensive analysis provides an insightful look into Block Inc. - SQ2 using Elliott Wave theo...

Read More >
S&P 500 Elliott Wave Technical Analysis: Insights on Bullish Trends, Wave Progressions, Risk Management, and Trading Strategies

S&P 500 Elliott Wave Technical Analysis: Insights on Bullish Trends, Wave Progressions, Risk Management, and Trading Strategies

S&P 500 Elliott Wave analysis for both daily and weekly charts highlighting bullish trends and impul...

Read More >
Elliott Wave Analysis for NASDAQ 100 & Key Stocks: Expert Insights & Trading Strategies

Elliott Wave Analysis for NASDAQ 100 & Key Stocks: Expert Insights & Trading Strategies

Dive into our latest Elliott Wave Analysis for the NASDAQ 100, including detailed insights and tradi...

Read More >
KOSPI Composite Index Elliott Wave Technical Analysis shows Bullish Trend Currently on both Daily and Weekly Charts

KOSPI Composite Index Elliott Wave Technical Analysis shows Bullish Trend Currently on both Daily and Weekly Charts

The KOSPI Composite is currently in a bullish trend, supported by Elliott Wave analysis on both dail...

Read More >
Cocoa Elliott Wave Technical Analysis: Key Market Trends and Strategies for Navigating the Cocoa Commodity Market.

Cocoa Elliott Wave Technical Analysis: Key Market Trends and Strategies for Navigating the Cocoa Commodity Market.

This article provides a comprehensive Elliott Wave analysis of Cocoa prices, focusing on the correct...

Read More >
Berkshire Hathaway Inc.(BRK.B:NYSE) Elliott Wave Technical Analysis 30 October 23

Berkshire Hathaway Inc.(BRK.B:NYSE) Elliott Wave Technical Analysis 30 October 23

Berkshire Hathaway Inc.(BRK.B:NYSE) Elliott Wave Technical Analysis 30 October 23, Stock Market Anal...

Read More >

$1 for 2 Weeks

then $29 a month!

What a Special Offer!

Trade Recommendations

Unleash the power of deversified trading with our comprehensive portfolio, covering 250+ markets:

  • Stock Trades
  • Crypto Trades
  • Forex Trades
  • Commodity Trades
Elliott Wave Analysis

Gain a competitive edge with expert insights and AI-powered Elliott Wave charting into:

  • Global Indices
  • US Stocks & ASX Stocks
  • Forex & Crypto
  • Commodities
Top-Notch Trading Tools

Equip yourself with the tools of success:

  • Real-time Chat rooms
  • Elliott Wave Algorithm
  • Portfolio tools
  • TradingLevels
  • Screener
  • Trading Game
7 Elliott Wave Analysts

Stay ahead of the market with daily charts and insightful videos
Your secret to strategic trading!

JOIN HERE


Welcome to TradingLounge (ASIC A.R.No. 321187), specialists in trades, trading education and technical analysis, covering stocks, indices, commodities, forex and cryptocurrencies.

When you join TradingLounge you have access to everything we offer, including trade tools, educational content and a social platform to chat with like-minded investors.

Read more

@Copyright 2024 by tradinglounge.com

Contact Us

Australian no: 02 4787 6020

International no: +61 (2) 47876020

Pay with:

Find us on