Silver (XAGUSD) Elliott Wave Technical Analysis
Silver Elliott Wave Analysis
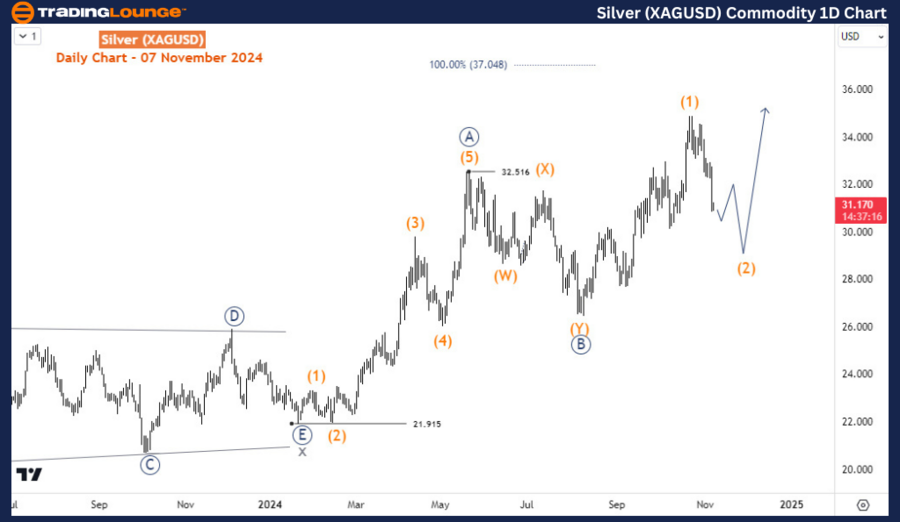
Silver has been in a downward correction since October 22, likely adjusting from its rally starting in August. Provided that this corrective phase does not dip below the August 7 low, the overall bullish trend should remain intact for the long term.
Silver (XAGUSD) Daily Chart Analysis
Silver’s upward momentum began in January 2024. It formed a completed impulse cycle by May, followed by a pullback in August, then resumed an upward move into a new impulse cycle. From August’s low, the price could evolve into either a 5-wave impulse structure or a 3-wave corrective structure. If it forms an impulse structure, the rally may continue towards the 43.5 target. If a 3-wave correction unfolds, the price might peak between 37 and 41. Thus, dips offer potential for further rallies. The current dip could signify wave (2) of ((C)) or wave (2) of ((3)), and it is expected to conclude above the August 7 low before resuming an upward trajectory.

Silver (XAGUSD) H4 Chart Analysis
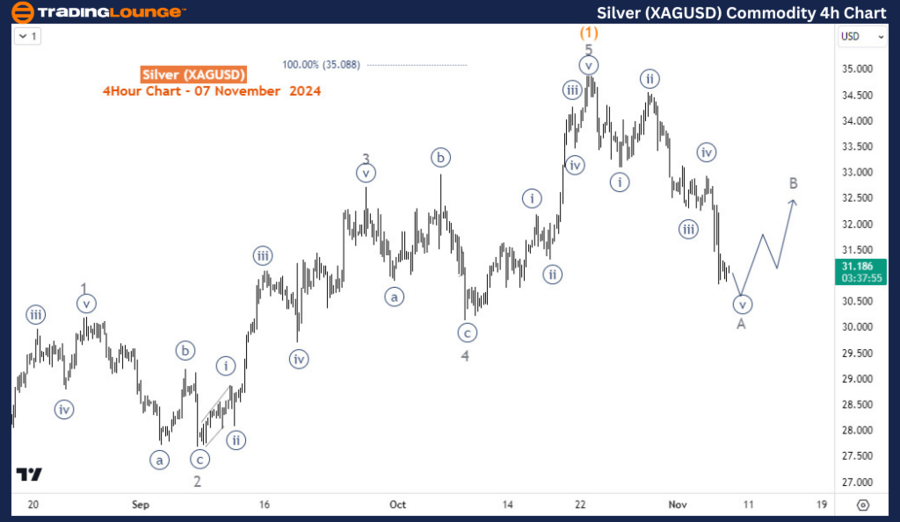
On the H4 timeframe, wave A of (2) appears near completion, suggesting a potential bounce in wave B followed by a further decline in wave C to complete wave (2).
Technical Analyst: Sanmi Adeagbo
Source: visit Tradinglounge.com and learn From the Experts Join TradingLounge Here
See Previous: Gold (XAUUSD) Commodity Elliott Wave Technical Analysis
VALUE Offer - Buy 1 Month & Get 3 Months!Click here
Access 7 Analysts Over 200 Markets Covered. Chat Room With Support

In Summary: Unless a strong upward impulse towards 34.5 materializes, a deeper correction for wave (2) remains a possibility.