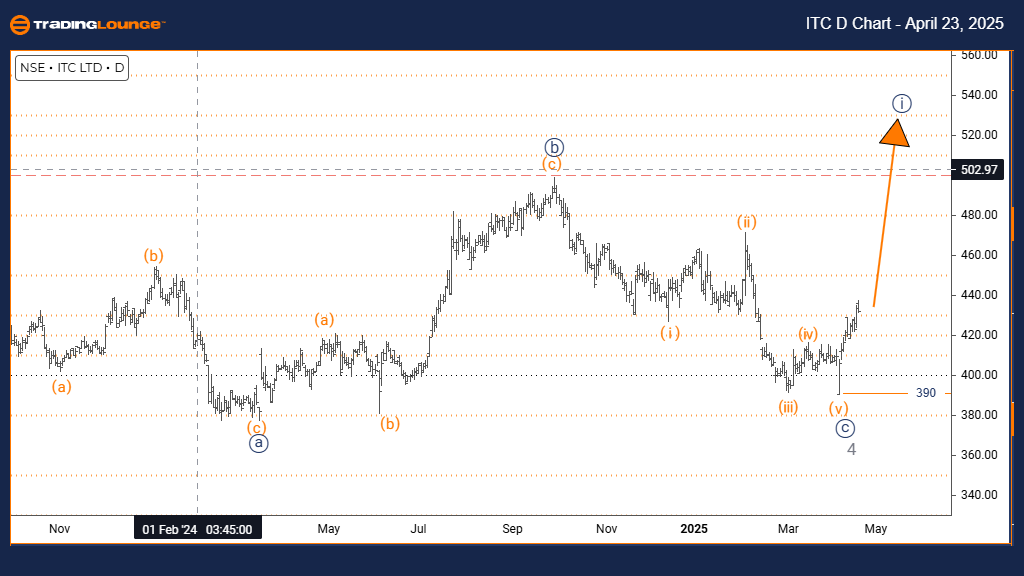
ITC INDIA – Elliott Wave Analysis – TradingLounge Day Chart
ITC INDIA Elliott Wave Technical Analysis
Function: Bullish Trend
Mode: Impulsive
Structure: Navy blue wave 1
Position: Gray wave 5
Direction Next Lower Degrees: Navy blue wave 2
Details: Gray wave 4 appears completed; navy blue wave 1 of gray wave 5 is currently in progress.
Wave Cancel Invalid Level: 390
ITC INDIA stock is advancing in a bullish trend on the daily chart, supported by an impulsive Elliott Wave structure. After the correction in gray wave 4, the price action confirms the start of navy blue wave 1 within the broader gray wave 5. This development signals the early stages of a final upward leg in the prevailing bullish cycle.
Navy blue wave 1 represents the beginning of this push higher and often builds strength as bullish sentiment grows. With gray wave 4 likely concluded, market structure sets the stage for an extended rise before the emergence of navy blue wave 2 correction. This upward movement can offer solid upside potential for swing traders and position traders.
Once navy blue wave 1 finalizes, a retracement in navy blue wave 2 is expected, providing a typical Elliott Wave corrective setup. The key level to watch remains 390—any drop below this threshold invalidates the current bullish count and calls for a reevaluation of the wave sequence.
Momentum indicators and volume trends will be crucial in validating the strength of this move. While gray wave 5 suggests the final part of the bullish trend, the current pattern presents a high-probability opportunity. Traders should monitor for possible signs of exhaustion as the wave progresses, such as bearish divergence or key resistance reactions.
This daily Elliott Wave forecast positions ITC INDIA as a strong technical candidate for bullish continuation, though discipline is essential as the wave nears its terminal phase.
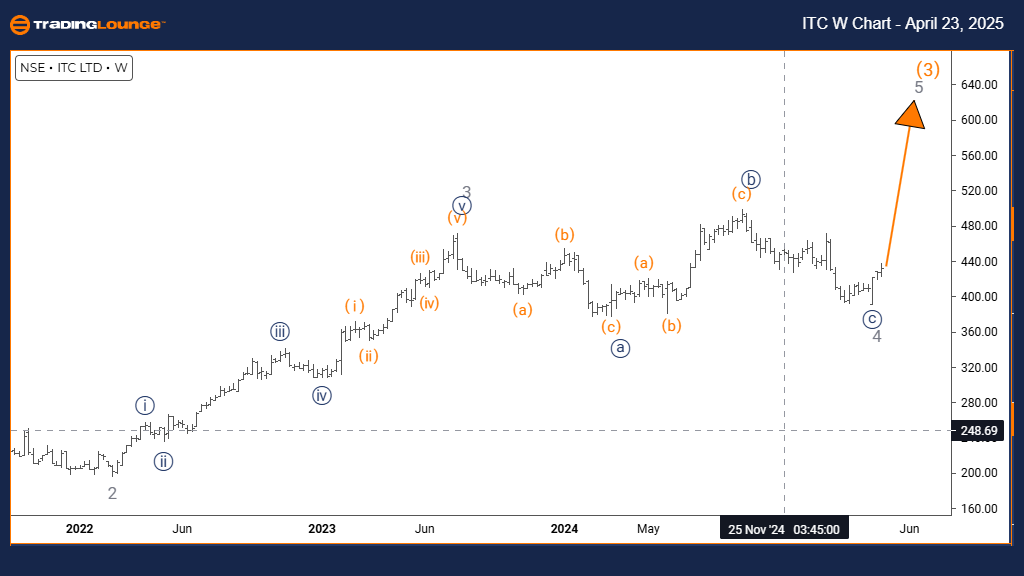
ITC INDIA – Elliott Wave Analysis – TradingLounge Weekly Chart
ITC INDIA Elliott Wave Technical Analysis
Function: Bullish Trend
Mode: Impulsive
Structure: Gray wave 5
Position: Orange wave 3
Direction Next Higher Degrees: Gray wave 5 (started)
Details: Gray wave 4 appears completed; gray wave 5 is now underway.
On the weekly timeframe, ITC INDIA showcases a bullish Elliott Wave formation advancing into gray wave 5, confirming the continuation of orange wave 3. With gray wave 4's correction likely behind us, the final impulse wave has begun, aiming to complete this medium-term bullish trend.
Wave 5 within an impulsive structure often drives price to new highs, although it may also reveal signs of slowing momentum near completion. Current chart signals point toward sustained strength, suggesting the market is progressing through the last wave of the current five-wave sequence.
This weekly analysis reflects a larger trend, indicating that while gray wave 5 may approach its end, it remains part of a broader bullish cycle. Technical indicators such as RSI divergence or candlestick exhaustion patterns will provide valuable clues on when momentum begins to wane.
Traders should stay alert for topping patterns as gray wave 5 matures. Although wave 5s can surprise with additional rallies, disciplined trade management is key, especially when nearing resistance zones. Price confirmation through volume and momentum studies will help time exits effectively.
Overall, ITC INDIA’s weekly Elliott Wave setup supports a strong bullish outlook, presenting strategic trade opportunities before a larger correction unfolds.
Technical Analyst: Malik Awais
Source: Visit Tradinglounge.com and learn from the Experts. Join TradingLounge Here
Previous: COAL INDIA Elliott Wave Technical Analysis
VALUE Offer - Buy 1 Month & Get 3 Months!Click here
Access 7 Analysts Over 200 Markets Covered. Chat Room With Support