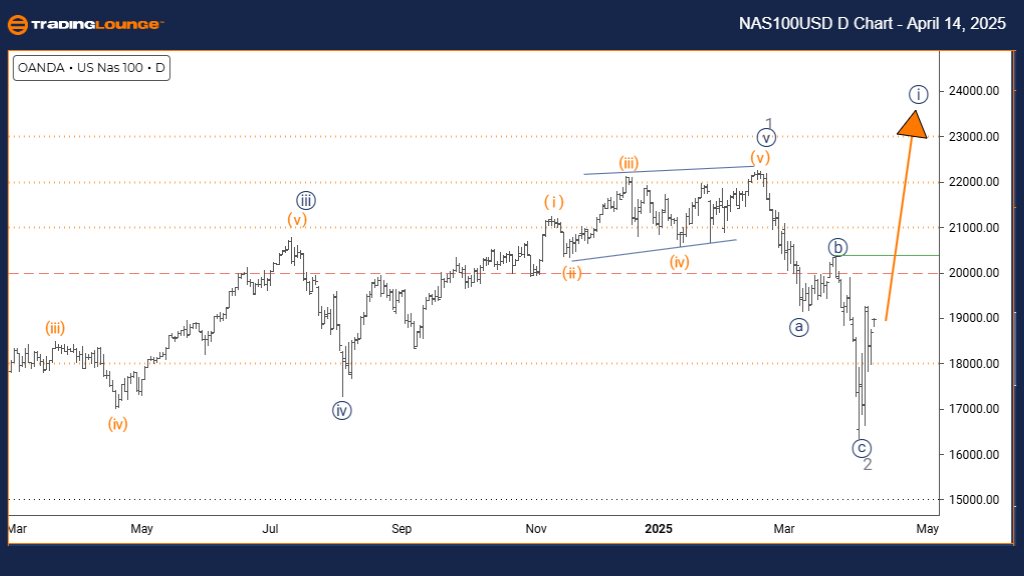
NASDAQ Elliott Wave Analysis – Trading Lounge Day Chart
NASDAQ Elliott Wave Technical Analysis
FUNCTION: Bullish Trend
MODE: Impulsive
STRUCTURE: Navy Blue Wave 1
POSITION: Gray Wave 3
DIRECTION NEXT LOWER DEGREES: Navy Blue Wave 2
DETAILS: Gray wave 2 appears completed; navy blue wave 1 of 3 is now unfolding.
The NASDAQ Daily Elliott Wave Analysis reveals a bullish trend in motion, supported by an impulsive wave structure. The recent completion of gray wave 2 signals the transition into navy blue wave 1, forming part of a larger gray wave 3 sequence. This development marks the beginning of a new upward phase within the broader bullish Elliott Wave pattern.
Navy blue wave 1, as the initial leg of a five-wave sequence, often sets the tone for the trend’s direction. Although it may lack the strength of wave 3, its role in establishing momentum is critical. The end of gray wave 2 has created favorable technical conditions for this current wave to advance, laying the foundation for continued bullish action.
As wave 1 progresses, traders should prepare for the emergence of navy blue wave 2—a likely corrective move offering potential entry on a pullback. Watching Fibonacci extension and retracement levels can help identify key inflection points that signal wave 1 completion and wave 2 initiation.
The daily timeframe highlights the early stages of a bullish Elliott Wave cycle. While explosive movement may not yet be visible, signs such as rising volume and steady price appreciation can validate the current wave count. Early positioning during this phase can provide strategic advantages ahead of stronger wave developments.
This Elliott Wave forecast suggests a measured yet optimistic outlook for bullish trades. As navy blue wave 1 unfolds within gray wave 3, sustained momentum is expected to build, offering multiple trading opportunities aligned with this larger uptrend structure.
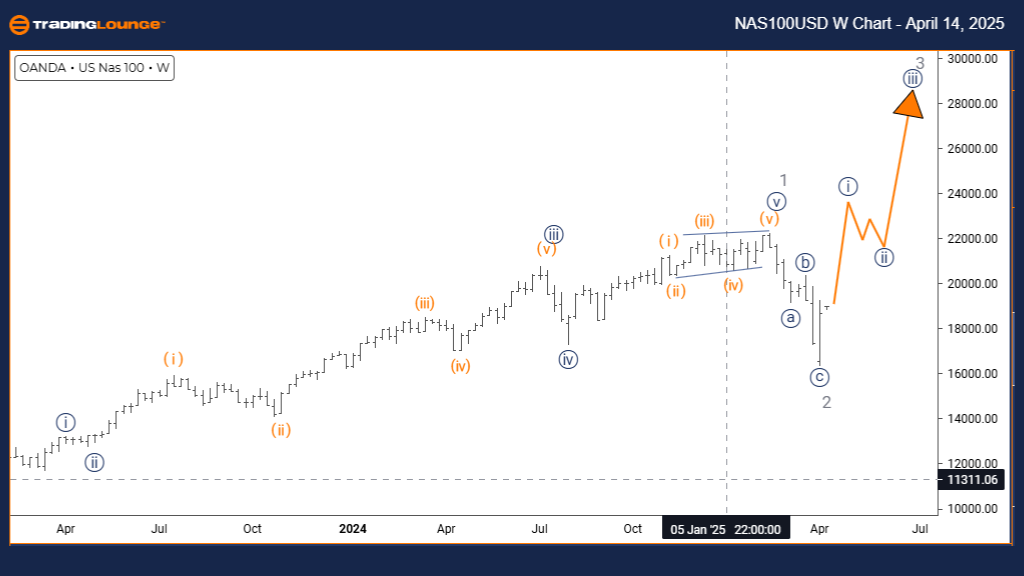
NASDAQ Elliott Wave Analysis – Trading Lounge Weekly Chart
NASDAQ Elliott Wave Technical Analysis
FUNCTION: Bullish Trend
MODE: Impulsive
STRUCTURE: Navy Blue Wave 1
POSITION: Gray Wave 3
DIRECTION NEXT LOWER DEGREES: Navy Blue Wave 2
DETAILS: Gray wave 2 appears completed; navy blue wave 1 of 3 is unfolding.
The NASDAQ Weekly Elliott Wave Analysis confirms a bullish trend under development, aligned with an impulsive wave sequence. With gray wave 2 correction now completed, the index has entered navy blue wave 1—part of the broader gray wave 3 movement. This signals a major shift from corrective to impulsive structure on higher timeframes, indicating sustained upside potential.
Navy blue wave 1 represents the beginning of this renewed bullish sequence. Typically, this wave builds slowly as sentiment transitions, setting the groundwork for future acceleration in wave 3. The structure so far supports a steady uptrend, laying a foundation for continued market strength.
Following the completion of navy blue wave 1, a pullback in the form of navy blue wave 2 is anticipated. This corrective move will likely offer a valuable opportunity to join the trend before the onset of a more aggressive bullish wave 3. Understanding this rhythm is key to optimizing trade entries and exits.
Weekly chart analysis is essential for recognizing the broader Elliott Wave cycle. Traders should observe signs like sustained bullish price action, rising volume, and confirmation from technical indicators to validate the end of wave 1. These cues help prepare for the corrective nature of wave 2 and the strong breakout potential of wave 3.
This outlook remains constructive for longer-term bullish strategies. With the market advancing into gray wave 3 territory, the path is open for continued upside, and the early phases offer the best positioning opportunities. Stay alert for key Fibonacci levels and structural patterns to fine-tune trade setups in line with this evolving Elliott Wave framework.
Technical Analyst: Malik Awais
Source: Visit Tradinglounge.com and learn from the Experts Join TradingLounge Here
Previous: S&P/TSX 60 Elliott Wave Technical Analysis
VALUE Offer - Buy 1 Month & Get 3 Months!Click here
Access 7 Analysts Over 200 Markets Covered. Chat Room With Support