10Jul

WTI Price Predictions, and Trading Strategies to navigate the oil Market effectively: Crudeoil Commodity Elliott Wave Technical Analysis

WTI Crudeoil Commodity Elliott Wave Technical Analysis

Function: Counter-trend for wave 2

Mode: Corrective

Structure: Impulse for wave a of 2

Position: Wave 2

Direction: Wave 3

Details: With the extended rally from 72.47, we count higher for wave 2. The structure from 72.7 is tricky, so we should wait for a 5-swing down below 80 to confirm the start of wave 3.

WTI Elliott Wave Technical Analysis

WTI crude oil is retreating after a month-long rally from June 4th to July 5th, 2024. This downside break suggests that the larger decline, which started in April 2024, has the potential to continue below the June 4th low. If the decline is not that deep, it should at least retrace 50% of the immediate rally to the April 5th low.

WTI Crudeoil Long-Term Analysis

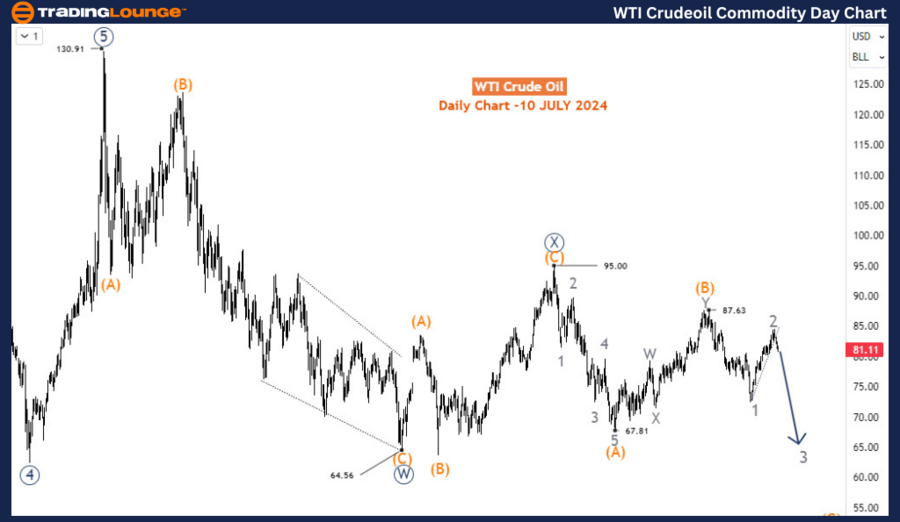
In the long term, WTI is undergoing a bearish correction. This correction is a response to the impulse rallies from the COVID-19 lows to the highs during the Russia/Ukraine conflict at $130.91. The bearish correction began at $130.91 in March 2022. The daily chart reveals that the long-term bearish corrective cycle is developing into a double zigzag structure. Wave W (circled) concluded at $64.56 in March 2024, followed by wave X (circled), which finished at $95 in September 2023. Wave Y (circled) then began, potentially forming a double zigzag subdivided into waves (A)-(B)-(C). Waves (A) and (B) ended at $67.8 and $87.6 in December 2023 and April 2024, respectively. The commodity is now anticipated to decline in wave (C), which could develop into either an impulse or a diagonal 5-wave structure. It appears that waves 1 and 2 of (C) have been completed, setting the stage for a decline in wave 3.
WTI-Crudeoil-Commodi...


WTI Crudeoil 4-Hour Chart Analysis

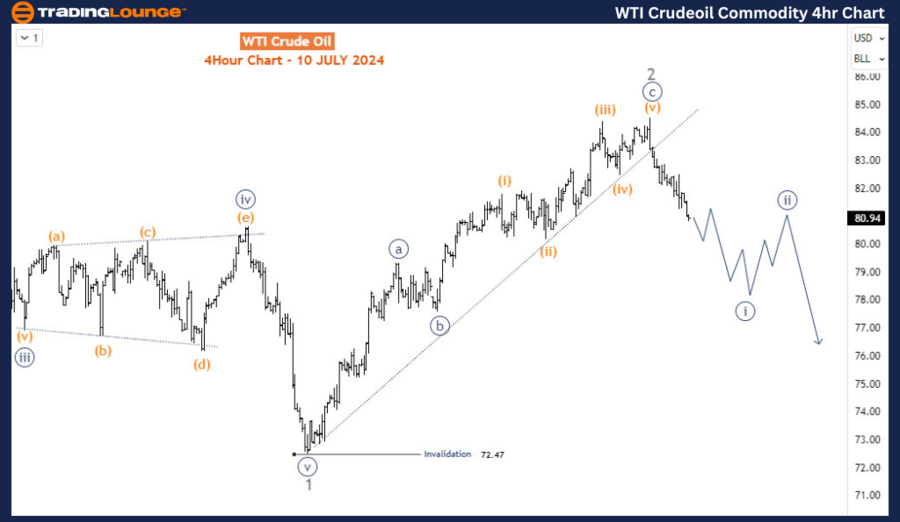
On the H4 chart, wave 2 appears to have ended with a zigzag structure, followed by a downside break for wave 3. A break below $80 with an impulse wave would confirm the start of wave 3. While the downside forecast for wave 3 is not yet solidified, there is a significant chance of a continuous decline toward and below $72.47 if the price stays below the current wave 2 high of $84.5.

Conclusion

Both the long-term and H4 charts indicate that WTI crude oil is amid a bearish correction with the potential for further declines. The double zigzag structure on the daily chart and the zigzag completion on the H4 chart suggest that the price is likely to continue its downward trajectory. By closely monitoring the development of wave (C) on the daily chart and wave 3 on the H4 chart, traders can identify strategic entry points to capitalize on the anticipated decline. If the price remains below $84.5, a substantial move toward $72.47 or lower is highly probable, providing ample opportunities for bearish positions.

Technical Analyst: Sanmi Adeagbo

Source: visit Tradinglounge.com and learn From the Experts Join TradingLounge Here 

See Previous: Silver XAGUSD Elliott Wave Technical Analysis

Special Trial Offer - 0.76 Cents a Day for 3 Months! Click here

Access 7 Analysts Over 170 Markets Covered. Chat Room With Support
WTI-Crudeoil-Commodi...

Related

Look at ASX LIMITED on the Australian Stock Exchange: ASX Stock Analysis & Elliott Wave Technical Forecast

Look at ASX LIMITED on the Australian Stock Exchange: ASX Stock Analysis & Elliott Wave Technical Forecast

Our Elliott Wave analysis provides an in-depth look at ASX LIMITED on the Australian Stock Exchange....

Read More >
Australian Dollar / Japanese Yen(AUDJPY) 4 Hour and Day Chart Elliott Wave Technical Analysis 12 October 23

Australian Dollar / Japanese Yen(AUDJPY) 4 Hour and Day Chart Elliott Wave Technical Analysis 12 October 23

In summary, the AUD/JPY Elliott Wave Analysis for 12 October 23, offers insights into the ongoing co...

Read More >
Maruti Suzuki Stocks Elliott Wave Technical Analysis: Understand Maruti Suzuki's Market Trends and Future Stock Levels

Maruti Suzuki Stocks Elliott Wave Technical Analysis: Understand Maruti Suzuki's Market Trends and Future Stock Levels

This article comprehensively analyses Maruti Suzuki's stock using Elliott Wave theory. It covers...

Read More >
HDFC Bank Stock Analysis: Elliott Wave, Daily and 4H Chart Insights, Key Resistance Levels, and Future Predictions

HDFC Bank Stock Analysis: Elliott Wave, Daily and 4H Chart Insights, Key Resistance Levels, and Future Predictions

This article provides a comprehensive Elliott Wave analysis of HDFC Bank's stock, featuring insi...

Read More >
NEO/ U.S. dollar(NEOUSD) Elliott Wave Technical Analysis 6 December 23

NEO/ U.S. dollar(NEOUSD) Elliott Wave Technical Analysis 6 December 23

NEO/ U.S. dollar(NEOUSD) Elliott Wave Technical Analysis dated 6 December 23, offers an in-depth per...

Read More >
Dogecoin Crypto Price News Today Elliott Wave Technical Analysis: Indicates a Bullish trend on both daily and 4-hour charts

Dogecoin Crypto Price News Today Elliott Wave Technical Analysis: Indicates a Bullish trend on both daily and 4-hour charts

In summary, the Elliott Wave analysis of Dogecoin against the U.S. Dollar indicates a bullish trend ...

Read More >

Buy 1 Month

Get 3 Months!

Special Offer:

Trade Recommendations

Unleash the power of deversified trading with our comprehensive portfolio, covering:

  • Stock Trades
  • Crypto Trades
  • Forex Trades
  • Commodity Trades
Elliott Wave Analysis

Gain a competive edge with expert insights in to:

  • Global Indices
  • US Stocks & ASX Stocks
  • Forex & Crypto
  • Commodities
Top-Notch Trading Tools

Equip yourself with the tools of success:

  • Social Chat
  • Elliott Wave Algorithm
  • Screener
  • TradingLevels
  • Trading Game
7 Elliott Wave Analysts

Stay ahead of the market with daily charts and insightful videos
-Your secret to strategic trading!

JOIN HERE


Welcome to TradingLounge (ASIC A.R.No. 321187), specialists in trades, trading education and technical analysis, covering stocks, indices, commodities, forex and cryptocurrencies.

When you join TradingLounge you have access to everything we offer, including trade tools, educational content and a social platform to chat with like-minded investors.

Read more

@Copyright 2024 by tradinglounge.com

Contact Us

Australian no: 02 4787 6020

International no: +61 (2) 47876020

Pay with:

Find us on