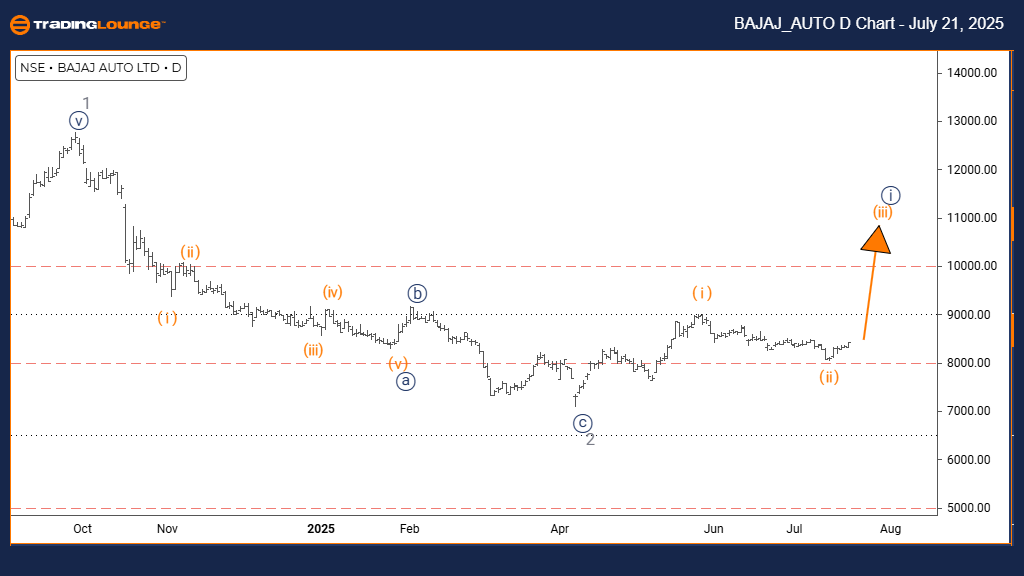
BAJAJ AUTO Elliott Wave Analysis – Trading Lounge Day Chart
BAJAJ AUTO Day Chart Analysis
BAJAJ AUTO Elliott Wave Technical Overview
FUNCTION: Bullish Trend
MODE: Impulsive
STRUCTURE: Orange Wave 3
POSITION: Navy Blue Wave 1
DIRECTION OF HIGHER DEGREES: Orange Wave 3 (Initiated)
DETAILS: Orange Wave 2 correction has likely concluded, initiating the rise of Orange Wave 3.
The daily Elliott Wave forecast for BAJAJ AUTO reveals a firm bullish trend, validated by an impulsive wave pattern. The current wave configuration signals the formation of Orange Wave 3 within the larger Navy Blue Wave 1 cycle. This setup indicates entry into a strong rally phase according to Elliott Wave principles. Evidence suggests the correction of Orange Wave 2 is over, and price action is now aligned with the acceleration phase of Orange Wave 3 — generally recognized as the most powerful segment in a bullish wave series.
The impulsive movement is characterized by steady upward momentum and sequential higher highs, suggesting robust demand, often driven by institutional buyers. Positioned inside Navy Blue Wave 1, Orange Wave 3 is expected to deliver significant upward potential. This transition from correction to impulse signals heightened opportunity for short-term and swing traders.
This wave analysis underlines a decisive trending phase, where Wave 3 movements typically produce major price surges. Traders should monitor the advancement of Orange Wave 3 closely, as such phases often attract increased market volume and broader interest. Entering Orange Wave 3 marks a critical point where bullish pressure tends to amplify.
From the daily chart’s perspective, the price trajectory confirms BAJAJ AUTO is in a broader uptrend. There remains room for further gains before encountering key resistance. This Elliott Wave interpretation offers actionable insights for aligning with the current bullish momentum while preparing for potential retracements. The impulsive wave structure highlights strong market sentiment and supports the outlook for additional price growth in the near term.
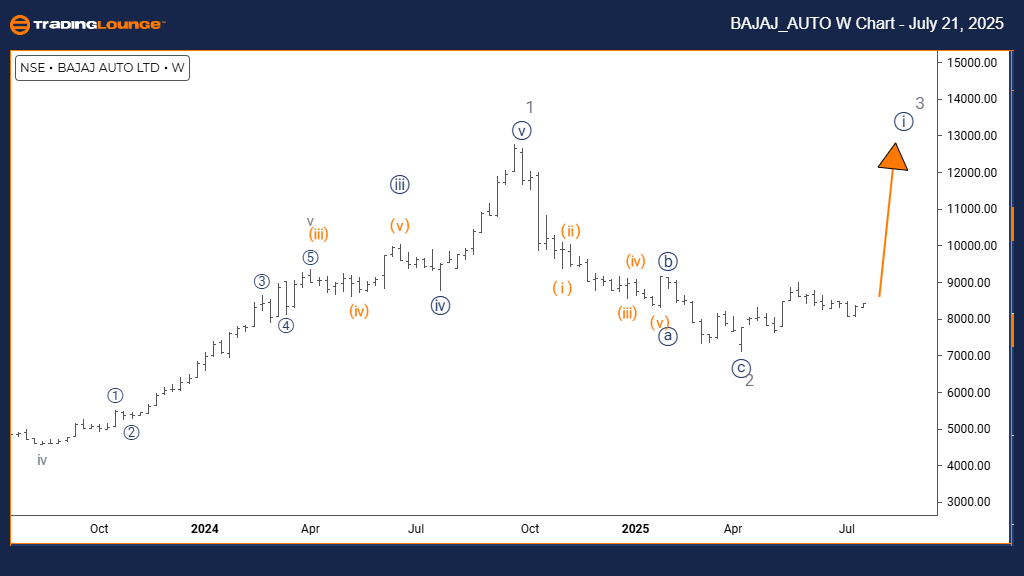
BAJAJ AUTO Elliott Wave Analysis – Trading Lounge Weekly Chart
BAJAJ AUTO Elliott Wave Technical Analysis
FUNCTION: Bullish Trend
MODE: Impulsive
STRUCTURE: Navy Blue Wave 1
POSITION: Gray Wave 3
DIRECTION OF HIGHER DEGREES: Navy Blue Wave 2
DETAILS: Gray Wave 2 correction appears complete. Navy Blue Wave 1 of 3 is now in progress.
The weekly Elliott Wave analysis for BAJAJ AUTO indicates a continued bullish environment shaped by a defined impulsive wave structure. Currently, Navy Blue Wave 1 is evolving within the larger framework of Gray Wave 3, signaling the beginning of a robust upward phase. Technical confirmation shows that Gray Wave 2 has likely concluded, initiating the start of Navy Blue Wave 1 — a primary move suggesting the onset of a broader uptrend.
This Elliott Wave setup demonstrates strong price action with sustained upward trajectory, marked by consistent higher highs. Such trends typically reflect steady accumulation, often led by institutional buying. As part of Gray Wave 3, Navy Blue Wave 1 is anticipated to lead the early stages of price expansion, offering an initial bullish leg before more complex wave structures emerge.
The weekly chart points to trend resilience and potential for long-term continuation. Following the completion of Navy Blue Wave 1, a corrective pullback — Navy Blue Wave 2 — is expected as the next development. Traders should remain alert for this transition to adjust strategies accordingly.
This analysis frames the current wave action within a longer-term bullish trend. The developing impulsive structure supports expectations of further gains, providing clarity on wave positioning and likely market behavior. The Elliott Wave layout enhances strategy alignment and readiness for coming shifts in the market. With the continuation of higher highs and higher lows, BAJAJ AUTO remains in a confirmed uptrend under the Elliott Wave framework.
Technical Analyst: Malik Awais
Source: Visit Tradinglounge.com and learn from the Experts. Join TradingLounge Here
Previous: DR REDDY LABORATORIES Elliott Wave Technical Analysis
VALUE Offer - $1 for 2 Weeks then $29 a month!Click here
Access 7 Analysts Over 200 Markets Covered. Chat Room With Support