TradingLounge BTCUSD Elliott Wave Analysis – Daily Chart
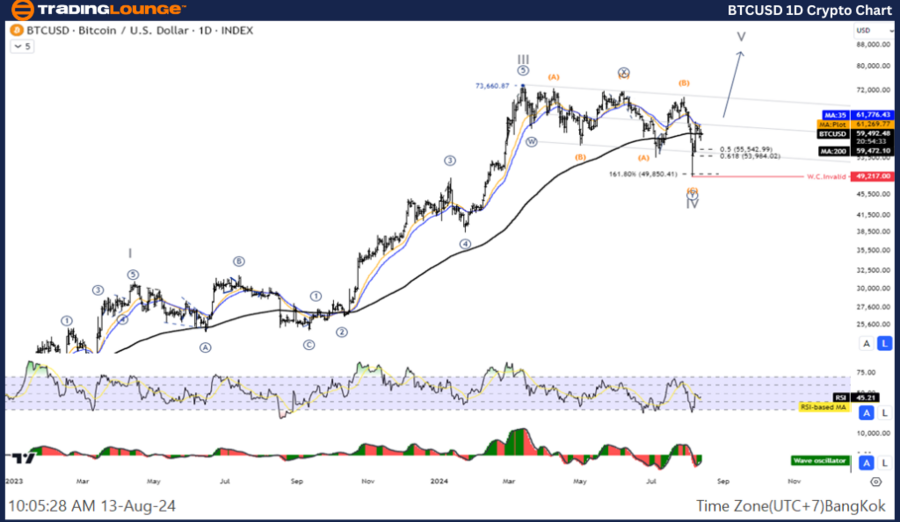
Bitcoin/U.S. Dollar (BTCUSD) Daily Chart Analysis
BTCUSD Elliott Wave Technical Analysis
Function: Counter Trend
Mode: Corrective
Structure: Double Corrective
Position: Wave ((Y))
Next Higher Degree: Wave IV
Wave Invalidation Level:
Details: The decline in Wave IV appears to be nearing its end, indicating that the price may soon resume its upward trend.
Bitcoin/U.S. Dollar (BTCUSD) Trading Strategy:
The ongoing fourth wave correction might not be complete, with a potential drop to test the 48,918 level. Traders should wait for the correction to conclude before seeking opportunities to enter the trend during the fifth wave.
Bitcoin/U.S. Dollar (BTCUSD) Technical Indicators: The price remains below the MA200, suggesting a downtrend, while the Wave Oscillator signals Bearish Momentum.

TradingLounge BTCUSD Elliott Wave Analysis – 4-Hour Chart
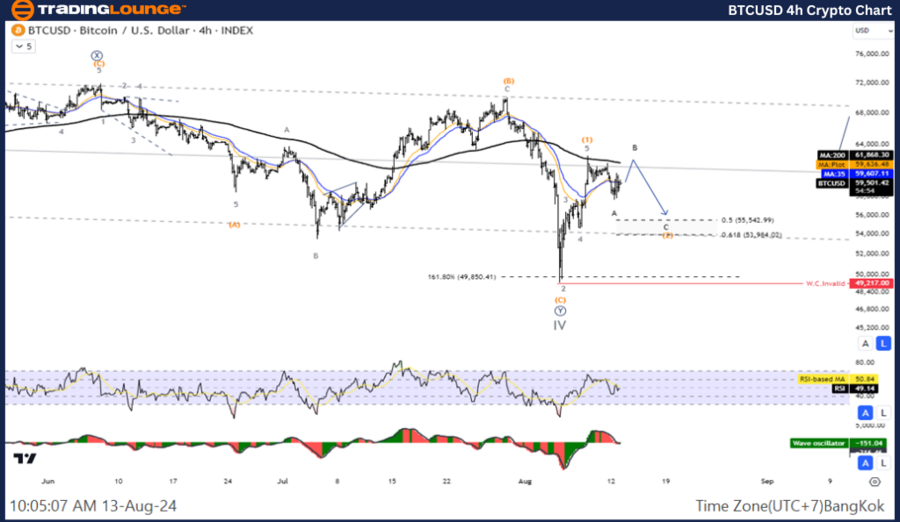
Bitcoin/U.S. Dollar (BTCUSD) 4-Hour Chart Analysis
BTCUSD Elliott Wave Technical Analysis
Function: Counter Trend
Mode: Corrective
Structure: Flat
Position: Wave B
Next Higher Degree: Wave (2)
Wave Invalidation Level:
Details: Wave (2) is anticipated to retrace 61.8% of Wave (1).
Bitcoin/U.S. Dollar (BTCUSD) Trading Strategy:
Similar to the daily chart, the fourth wave correction seems incomplete, and a price drop towards the 48,918 level is likely. Wait for this correction to end before re-entering the market in the fifth wave.
Bitcoin/U.S. Dollar (BTCUSD) Technical Indicators: The price remains below the MA200, indicating a downtrend, and the Wave Oscillator continues to show Bearish Momentum.
Technical Analyst: Kittiampon Somboonsod
Source: visit Tradinglounge.com and learn From the Experts Join TradingLounge Here
See Previous: VeChain / U.S. Dollar (VETUSD) Elliott Wave Technical Analysis
Special Trial Offer - 0.76 Cents a Day for 3 Months! Click here
Access 7 Analysts Over 170 Markets Covered. Chat Room With Support
