Welcome to our latest Elliott Wave analysis for Costco Wholesale Corp. (COST). This comprehensive analysis delves into COST's price movements using Elliott Wave Theory to help traders identify potential opportunities based on current trends and market structure. We will cover insights from both the daily and 4-hour charts, providing a thorough perspective on COST's market behavior.

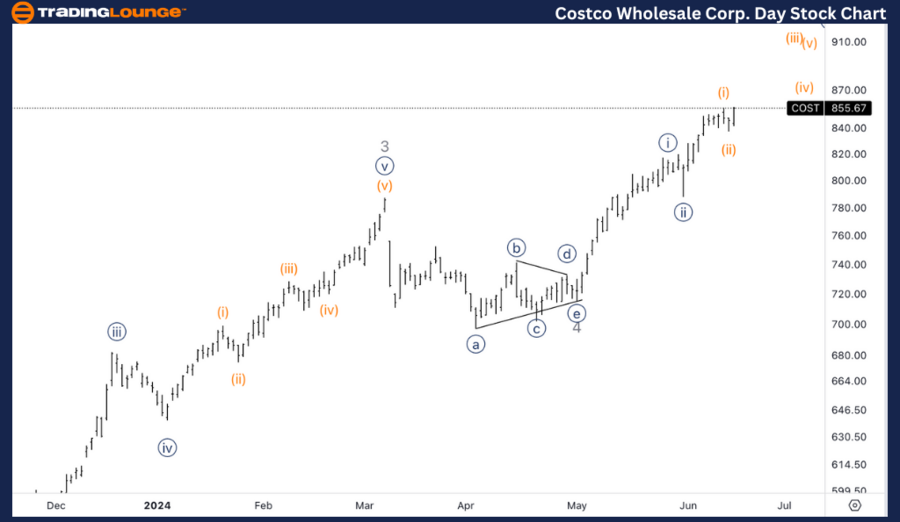
COST Elliott Wave Analysis: Trading Lounge Daily Chart

Costco Wholesale Corp. (COST) Daily Chart Analysis

Function: Trend

Mode: Impulsive

Structure: Motive

Position: Wave 5

Direction: Upside in wave {iii}

Details: We are looking for an upside into wave {iii} as wave {ii} of 5 seems to have completed after successfully finishing the triangle in wave 4.

COST Elliott Wave Technical Analysis

In our Elliott Wave analysis of Costco Wholesale Corp. (COST), we observe an impulsive trend characterized by a motive structure. COST is currently positioned in wave 5, specifically in wave {iii} of 5, indicating an upward move. After successfully completing the triangle in wave 4, COST has finished wave {ii} of 5 and is now poised to move higher into wave {iii}. This wave is expected to gain momentum, pushing prices upward as it unfolds. Traders should monitor the progression of wave {iii} closely, as it may present opportunities for long positions, especially if COST continues to show strength above key resistance levels.
Costco-Wholesale-Cor...


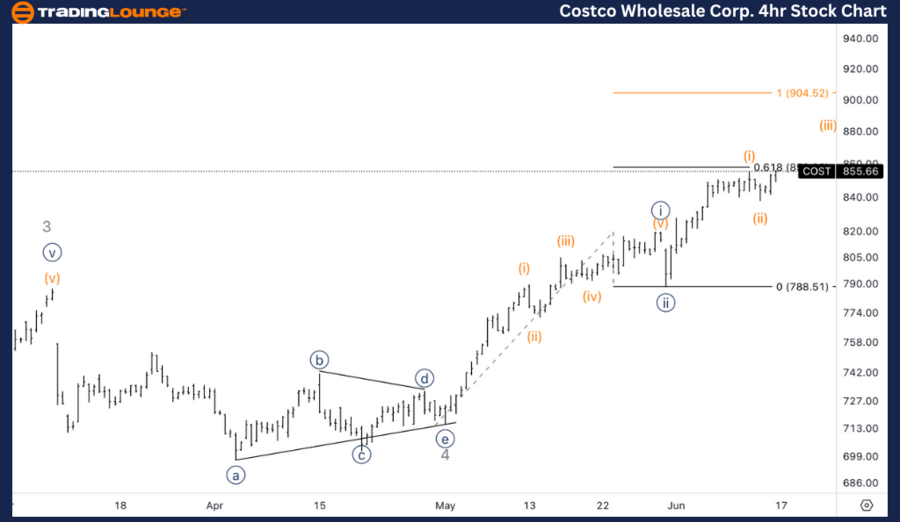
COST Elliott Wave Analysis: Trading Lounge 4-Hour Chart

Costco Wholesale Corp. (COST) 4-Hour Chart Analysis

Function: Trend

Mode: Impulsive

Structure: Motive

Position: Wave (iii) of {iii}

Direction: Wave (iii)

Details: We are looking for an upside into wave (iii), knowing we could switch to a more conservative count where the current wave (i) and (ii) are wave {iii} and {iv}. The equality of {iii} vs. {i} stands at $900.

COST Elliott Wave Technical Analysis

On the 4-hour chart, COST is also following an impulsive trend within a motive structure, specifically in wave (iii) of {iii}. The analysis suggests an upside continuation into wave (iii), with the awareness that the current wave (i) and (ii) might be a more conservative count as wave {iii} and {iv}. This suggests that if the market confirms this alternate view, COST could target the equality of wave {iii} vs. wave {i} at $900. Traders should be prepared for potential adjustments in the wave count and watch for consolidation or corrective patterns that might precede further upward movements.

Technical Analyst: Alessio Barretta

Source: visit Tradinglounge.com and learn From the Experts Join TradingLounge Here 

See Previous: Visa Inc., (V) Elliott Wave Technical Analysis

Special Trial Offer - 0.76 Cents a Day for 3 Months! Click here

Access 7 Analysts Over 170 Markets Covered. Chat Room With Support
Costco-Wholesale-Cor...

Related

Nikkei 225 Index Elliott Wave Technical Analysis: Timely Updates, Expert Forecasts, and Recommended N225 investment tips

Nikkei 225 Index Elliott Wave Technical Analysis: Timely Updates, Expert Forecasts, and Recommended N225 investment tips

Dive into a comprehensive Elliott Wave analysis of the Nikkei 225 (N225) with insights on bullish tr...

Read More >
Soybeans Elliott Wave Technical Analysis: Highlighting Current Commodity Market Trends and Bearish Trend

Soybeans Elliott Wave Technical Analysis: Highlighting Current Commodity Market Trends and Bearish Trend

This article provides an in-depth Soybeans Elliott Wave analysis, market trends and price forecasts...

Read More >
TATA MOTORS Stocks Elliott Wave Technical Analysis - Stock Could be Approaching a Deeper Correction

TATA MOTORS Stocks Elliott Wave Technical Analysis - Stock Could be Approaching a Deeper Correction

This analysis of TATA Motors stock explores the current Elliott Wave counts and provides a detailed ...

Read More >
Gold XAUUSD Commodity Elliott Wave Analysis: Explore the Current Price Trends, Wave Structures, and Future Projections

Gold XAUUSD Commodity Elliott Wave Analysis: Explore the Current Price Trends, Wave Structures, and Future Projections

In this comprehensive Gold Elliott Wave Analysis, we explore the current price trends, wave structur...

Read More >
Ripple/U.S. dollar(XRPUSD) Elliott Wave Technical Analysis 19 December 23

Ripple/U.S. dollar(XRPUSD) Elliott Wave Technical Analysis 19 December 23

Ripple/U.S. dollar(XRPUSD) Elliott Wave Technical Analysis dated 19 December 23, Ripple Crypto Analy...

Read More >

Buy 1 Month

Get 3 Months!

Special Offer:

Trade Recommendations

Unleash the power of deversified trading with our comprehensive portfolio, covering:

  • Stock Trades
  • Crypto Trades
  • Forex Trades
  • Commodity Trades
Elliott Wave Analysis

Gain a competive edge with expert insights in to:

  • Global Indices
  • US Stocks & ASX Stocks
  • Forex & Crypto
  • Commodities
Top-Notch Trading Tools

Equip yourself with the tools of success:

  • Social Chat
  • Elliott Wave Algorithm
  • Screener
  • TradingLevels
  • Trading Game
7 Elliott Wave Analysts

Stay ahead of the market with daily charts and insightful videos
-Your secret to strategic trading!

JOIN HERE


Welcome to TradingLounge (ASIC A.R.No. 321187), specialists in trades, trading education and technical analysis, covering stocks, indices, commodities, forex and cryptocurrencies.

When you join TradingLounge you have access to everything we offer, including trade tools, educational content and a social platform to chat with like-minded investors.

Read more

@Copyright 2024 by tradinglounge.com

Contact Us

Australian no: 02 4787 6020

International no: +61 (2) 47876020

Pay with:

Find us on