Welcome to our latest Elliott Wave analysis for Visa Inc. (V) as of June 13, 2024. This analysis provides an in-depth look at V's price movements using the Elliott Wave Theory, helping traders identify potential opportunities based on current trends and market structure. We will cover insights from both the daily and 4-hour charts to offer a comprehensive perspective on V's market behaviour.

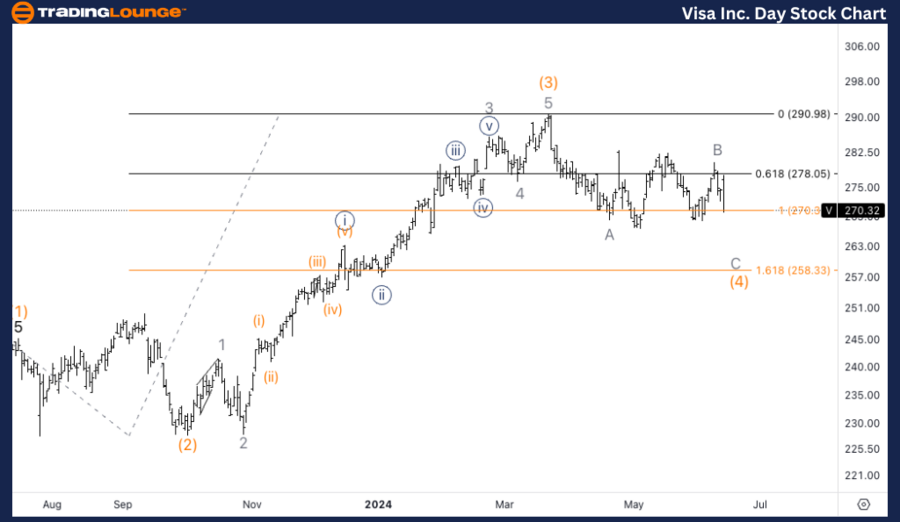
V Elliott Wave Analysis Trading Lounge Daily Chart

Visa Inc., (V) Daily Chart Analysis

FUNCTION: Counter Trend

MODE: Corrective

STRUCTURE: Flat

POSITION: Minor wave C

DIRECTION: Downside in wave C

DETAILS: We are standing at equality of (4) vs. (2) at $270. Looking for either a triangle in wave (4) or else, a triangle in wave B as displayed.

V Elliott Wave Technical Analysis

In our Elliott Wave analysis of Visa Inc. (V), we observe a counter-trend corrective pattern characterized by a Flat structure. V is currently positioned in Minor wave C, indicating a downside move in wave C. The analysis shows that V has reached the equality of wave (4) vs. wave (2) at $270. We are monitoring for either a triangle formation in wave (4) or a continuation pattern in wave B as depicted. Traders should watch for further declines and potential completion of wave C, with a focus on price behavior around the $270 level to gauge whether a triangle will form or if a more direct path downward will unfold.

Visa-Inc-day-Stock-C...


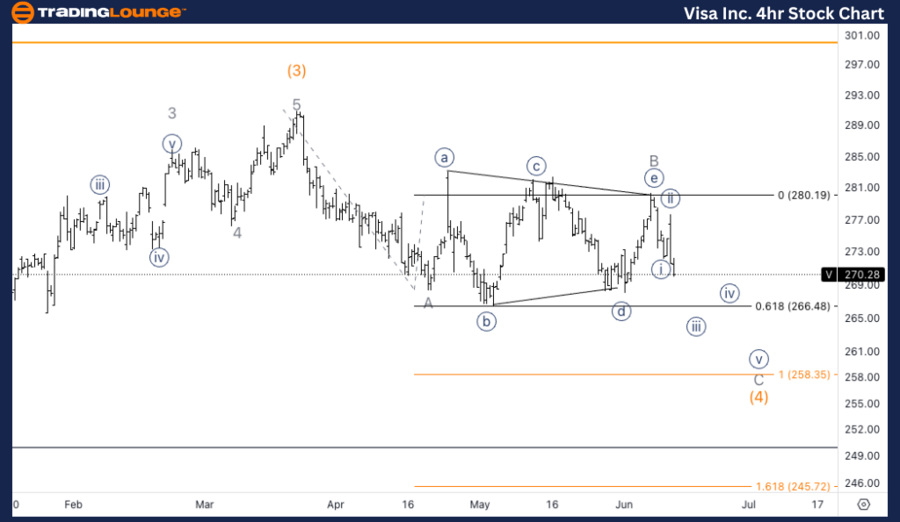
V Elliott Wave Analysis Trading Lounge 4Hr Chart

Visa Inc., (V) 4Hr Chart Analysis

FUNCTION: Counter Trend

MODE: Corrective

STRUCTURE: Flat

POSITION: Wave {iii} of C

DIRECTION: Downside in {iii}

DETAILS: Looking for equality of C vs. A as $258 as main downside target for this scenario.

V Elliott Wave Technical Analysis

On the 4-hour chart, V is following a counter-trend corrective mode within a Flat structure, specifically in wave {iii} of C. The current analysis indicates that V is targeting equality of wave C vs. wave A at $258 as the main downside objective. This target serves as a key level for potential support where a bounce could occur. Traders should observe the approach to $258 closely, as this level may offer opportunities for positioning either for a short-term reversal or continuation based on further pattern development.

Technical Analyst: Alessio Barretta

Source: visit Tradinglounge.com and learn From the Experts Join TradingLounge Here 

See Previous: QCOM Elliott Wave Technical Analysis

Special Trial Offer - 0.76 Cents a Day for 3 Months! Click here

Access 7 Analysts Over 170 Markets Covered. Chat Room With Support

Visa-Inc-4hr-Stock-C...

Related

Dogecoin / U.S. dollar(DOGEUSD) Elliott Wave Technical Analysis 20 November 23

Dogecoin / U.S. dollar(DOGEUSD) Elliott Wave Technical Analysis 20 November 23

Dogecoin / U.S. dollar(DOGEUSD) Elliott Wave Technical Analysis On 20 November 23, Elliott Wave Anal...

Read More >
DOW JONES Elliott Wave Forecast Reveals Bullish Impulse Structure on DJI Daily and Weekly Charts With Key Price Support

DOW JONES Elliott Wave Forecast Reveals Bullish Impulse Structure on DJI Daily and Weekly Charts With Key Price Support

Elliott Wave analysis of the DOW JONES (DJI), highlighting bullish trends in daily and weekly charts...

Read More >
Elliott Wave Commodity Market Analysis: Bitcoin, ETH/USD, Bonds, USD, Gold, Silver, Copper, Uranium, Crude Oil, Natural Gas Insights

Elliott Wave Commodity Market Analysis: Bitcoin, ETH/USD, Bonds, USD, Gold, Silver, Copper, Uranium, Crude Oil, Natural Gas Insights

Commodity Market Elliott Wave Analysis Update: - Bitcoin (BTC) and Ethereum (ETH/USD): Advancing in...

Read More >
Deere & Co. (DE) Stocks Elliott Wave Technical Analysis: Key Support Levels, Forecasts, and Technical Outlook

Deere & Co. (DE) Stocks Elliott Wave Technical Analysis: Key Support Levels, Forecasts, and Technical Outlook

This comprehensive Elliott Wave analysis of Deere & Co. (DE) offers traders valuable insights into t...

Read More >
JP Morgan Chase & Co.(JPM:NYSE) Elliott Wave Technical Analysis Chart 13 October 23

JP Morgan Chase & Co.(JPM:NYSE) Elliott Wave Technical Analysis Chart 13 October 23

Trading Lounge Elliott Wave Technical Analysis Chart of JPM Stock for 13 October 23.

Read More >
S&P 500 ELLIOTT WAVE ANALYSIS, 23 FEB 2022

S&P 500 ELLIOTT WAVE ANALYSIS, 23 FEB 2022

SP500 The Feds rise in rates to control inflation are placing more pressure on the markets. Plus the...

Read More >

$1 for 2 Weeks

then $29 a month!

What a Special Offer!

Trade Recommendations

Unleash the power of deversified trading with our comprehensive portfolio, covering 250+ markets:

  • Stock Trades
  • Crypto Trades
  • Forex Trades
  • Commodity Trades
Elliott Wave Analysis

Gain a competitive edge with expert insights and AI-powered Elliott Wave charting into:

  • Global Indices
  • US Stocks & ASX Stocks
  • Forex & Crypto
  • Commodities
Top-Notch Trading Tools

Equip yourself with the tools of success:

  • Real-time Chat rooms
  • Elliott Wave Algorithm
  • Portfolio tools
  • TradingLevels
  • Screener
  • Trading Game
7 Elliott Wave Analysts

Stay ahead of the market with daily charts and insightful videos
Your secret to strategic trading!

JOIN HERE


Welcome to TradingLounge (ASIC A.R.No. 321187), specialists in trades, trading education and technical analysis, covering stocks, indices, commodities, forex and cryptocurrencies.

When you join TradingLounge you have access to everything we offer, including trade tools, educational content and a social platform to chat with like-minded investors.

Read more

@Copyright 2024 by tradinglounge.com

Contact Us

Australian no: 02 4787 6020

International no: +61 (2) 47876020

Pay with:

Find us on