21Jan

Netflix Inc. (NFLX) Elliott Wave Technical Analysis: Investment Insights, Financial Performance, and Growth Potential for 2025

NFLX Elliott Wave Analysis – Technical Outlook and Forecast

In this Elliott Wave analysis, we will examine the trend structure of Netflix Inc. (NFLX) using both the daily and 1-hour charts, aiming to evaluate the current wave position and anticipate potential price movements.

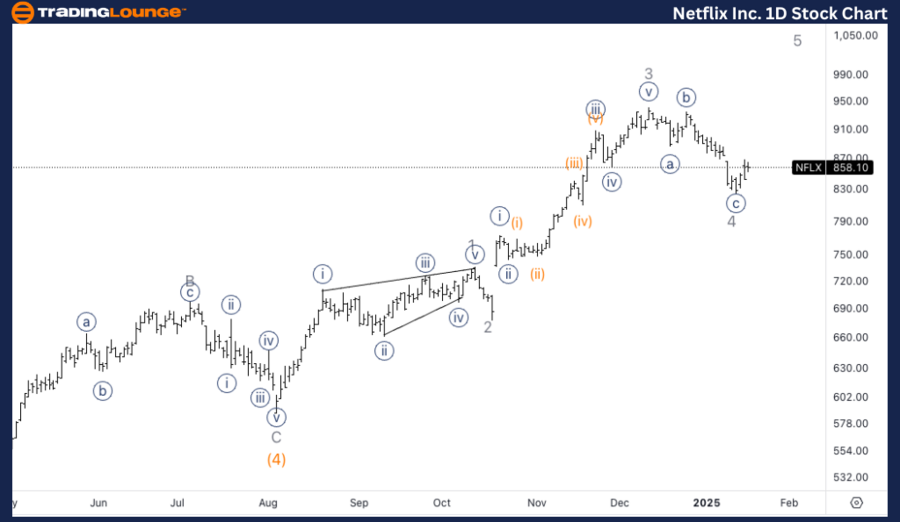
Netflix Inc. (NFLX) Elliott Wave Analysis – Trading Lounge Daily Chart

NFLX Technical Analysis Summary:

Function: Counter Trend

Mode: Corrective

Structure: Flat

Current Position: Wave 4 of (5)

Expected Direction: Upside in wave 5

Analysis Details:
A potential bottom in wave {c} of 4 may have formed, indicating the corrective phase could be nearing completion. If confirmed, the price is expected to advance higher toward Trading Level 1 at $1000, marking the beginning of wave 5.

NFLX Elliott Wave Technical Analysis – Daily Chart

We are closely observing a potential bottom formation in wave {c} of 4, suggesting that the ongoing corrective phase might be concluding. If this bottom is confirmed, the next anticipated move is an upward trajectory targeting Trading Level 1 at $1000, aligning with the continuation of the impulsive wave 5 cycle.

Key Takeaways:

  • Potential bottom in wave {c} of 4
  • Upside projection toward $1000 target
  • Expected continuation in wave 5 if bottom holds

Netflix-Inc-1d-stock...


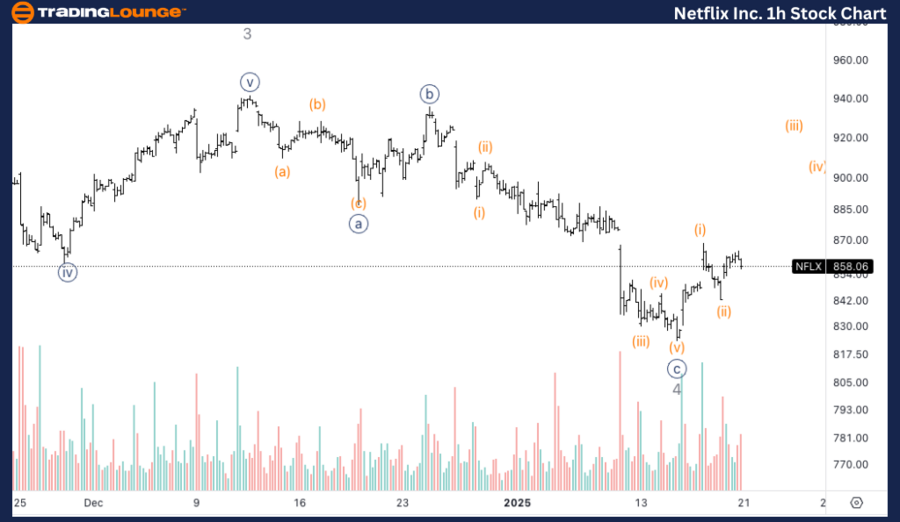
NFLX Elliott Wave Technical Analysis – Trading Lounge 1-Hour Chart

NFLX Technical Analysis Summary:

Function: Counter Trend

Mode: Corrective

Structure: Flat

Current Position: Wave (ii) of {i}

Expected Direction: Upside in wave (iii)

Analysis Details:
Monitoring for a bottom in wave {c} of 4, with growing volume around the lows signaling that the bottom could already be in place. The next move is expected as wave (ii) of {i}, which may be either completed or approaching completion, setting the stage for an upward push into wave (iii).

NFLX Elliott Wave Technical Analysis – 1H Chart Insights

We are looking for signs confirming the bottom in wave {c} of 4, supported by increasing volume near the lows, which may indicate that the corrective phase is over. Once wave (ii) of {i} completes, a strong upward movement into wave (iii) is anticipated as the next phase of the uptrend develops.

Key Takeaways:

  • Bottom formation in wave {c} of 4
  • Increased volume suggests reversal confirmation
  • Anticipation of strong upside movement in wave (iii)

Technical Analyst: Alessio Barretta

Source: visit Tradinglounge.com and learn From the Experts Join TradingLounge Here 

See Previous: Amazon Inc. (AMZN) Elliott Wave Technical Analysis

VALUE Offer - Buy 1 Month & Get 3 Months!Click here

Access 7 Analysts Over 200 Markets Covered. Chat Room With Support

Netflix-Inc-1h-stock...

Related

Elliott Wave analysis for Coca-Cola (KO) provides a comprehensive stock forecast, Including a Price Target, and Current Trend insights

Elliott Wave analysis for Coca-Cola (KO) provides a comprehensive stock forecast, Including a Price Target, and Current Trend insights

This Elliott Wave analysis for Coca-Cola (KO) provides a comprehensive stock forecast, including a p...

Read More >
Asx Stock's Potential Movement Stay Updated with our NWS Stock Analysis & Elliott Wave Technical Forecast

Asx Stock's Potential Movement Stay Updated with our NWS Stock Analysis & Elliott Wave Technical Forecast

Our detailed Elliott Wave analysis on ASX: News Corporation (NWS) provides a comprehensive outlook o...

Read More >
Providing Forecasts for the British Pound to U.S. Dollar Currency Pair: GBPUSD Forex Elliott Wave Technical Analysis

Providing Forecasts for the British Pound to U.S. Dollar Currency Pair: GBPUSD Forex Elliott Wave Technical Analysis

Our detailed GBPUSD Elliott Wave analysis covers daily and 4-hour chart evaluations, providing forec...

Read More >
Hang Seng Index Elliott Wave Technical Analysis: Market Trends, Wave Count, Price Prediction, and Trading Strategy for Investors

Hang Seng Index Elliott Wave Technical Analysis: Market Trends, Wave Count, Price Prediction, and Trading Strategy for Investors

Elliott Wave analysis of the Hang Seng Index, covering both daily and weekly chart forecasts. It exa...

Read More >
XRP/ U.S. Dollar (XRPUSD) Elliott Wave Analysis and Price Prediction March 2025 with Key Support, and Swing Trade Strategy

XRP/ U.S. Dollar (XRPUSD) Elliott Wave Analysis and Price Prediction March 2025 with Key Support, and Swing Trade Strategy

Elliott Wave breakdown of XRP/USD for both daily and H4 charts. It includes short-term price predict...

Read More >
Neo/ U.S. dollar(NEOUSD) Elliott Wave Technical Analysis: Riding the Uptrend Wave

Neo/ U.S. dollar(NEOUSD) Elliott Wave Technical Analysis: Riding the Uptrend Wave

Explore our latest NEO/USD Elliott Wave Analysis for March 6, 2024, to uncover valuable insights int...

Read More >

Buy 1 Month

Get 3 Months!

Special Offer:

Trade Recommendations

Unleash the power of deversified trading with our comprehensive portfolio, covering:

  • Stock Trades
  • Crypto Trades
  • Forex Trades
  • Commodity Trades
Elliott Wave Analysis

Gain a competive edge with expert insights in to:

  • Global Indices
  • US Stocks & ASX Stocks
  • Forex & Crypto
  • Commodities
Top-Notch Trading Tools

Equip yourself with the tools of success:

  • Social Chat
  • Elliott Wave Algorithm
  • Screener
  • TradingLevels
  • Trading Game
7 Elliott Wave Analysts

Stay ahead of the market with daily charts and insightful videos
-Your secret to strategic trading!

JOIN HERE


Welcome to TradingLounge (ASIC A.R.No. 321187), specialists in trades, trading education and technical analysis, covering stocks, indices, commodities, forex and cryptocurrencies.

When you join TradingLounge you have access to everything we offer, including trade tools, educational content and a social platform to chat with like-minded investors.

Read more

@Copyright 2024 by tradinglounge.com

Contact Us

Australian no: 02 4787 6020

International no: +61 (2) 47876020

Pay with:

Find us on