07Jul

Snowflake SNOW Elliott Wave Bullish Analysis: Daily Wave V & Weekly Wave III Forecasts Offer High‑Probability Trading Setup

Snowflake Inc. (SNOW) – Elliott Wave Analysis | Trading Lounge Daily Chart

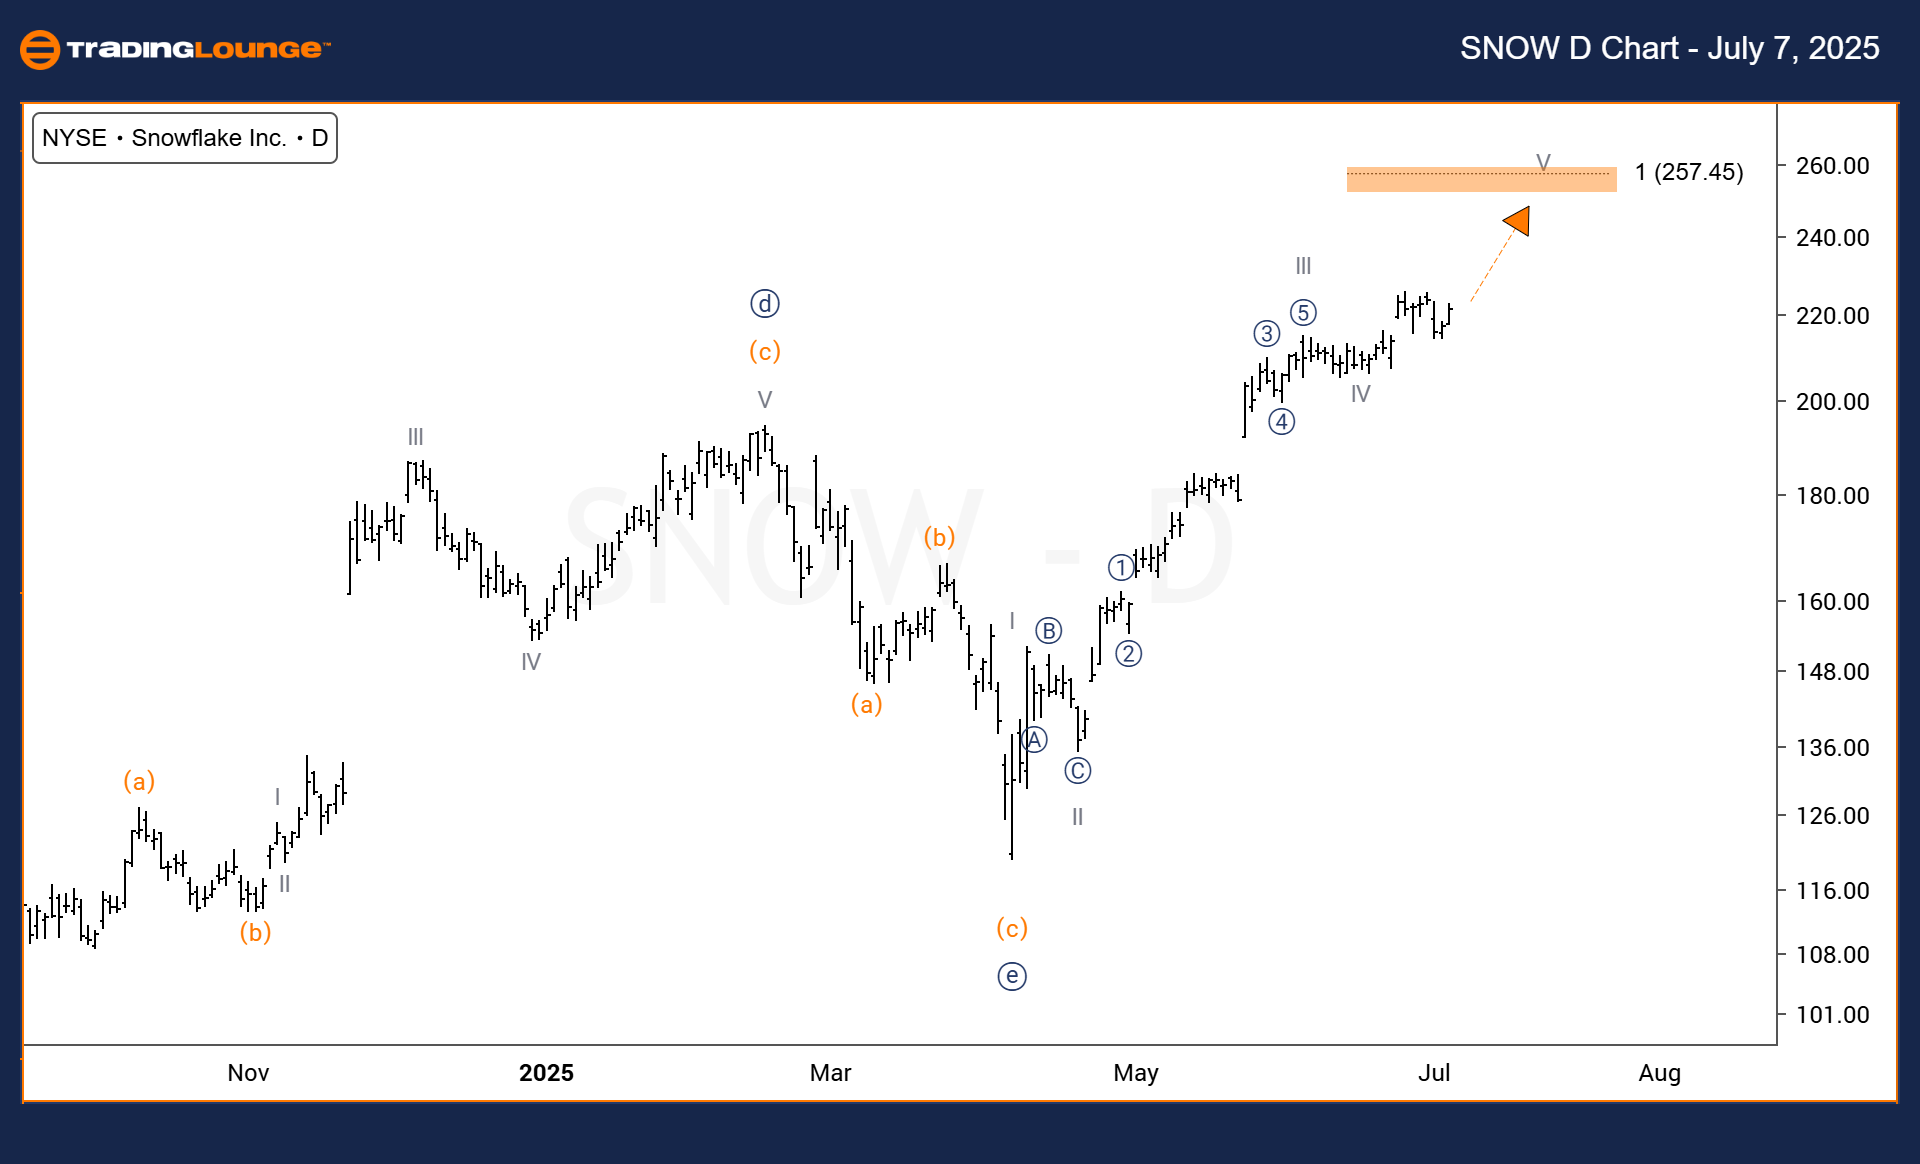
Snowflake Inc. (SNOW) Daily Chart Analysis and Overview

Snowflake Inc. (SNOW) Elliott Wave Technical Analysis

Function: Trend

Mode: Impulsive

Structure: Impulsive

Position: Wave V

Direction: Uptrend toward Wave V

Details: A bullish impulsive wave is in progress, with Wave V expected to mirror the length of Wave I, signaling strong upward potential.

Daily Chart Summary:

Snowflake Inc. (NASDAQ: SNOW) is showing a continued bullish trend on the daily chart, suggesting further upside movement. The Elliott Wave count identifies the stock in Wave V, which is developing after Wave III extended earlier in the cycle. Based on this pattern, Wave V is likely to match the length of Wave I, indicating a potential bullish breakout. The price is approaching key resistance levels, and a confirmed breakout could solidify the trend continuation. This offers a promising setup for short-term traders seeking bullish exposure.

SNOW-us-stocks-D-Cha...


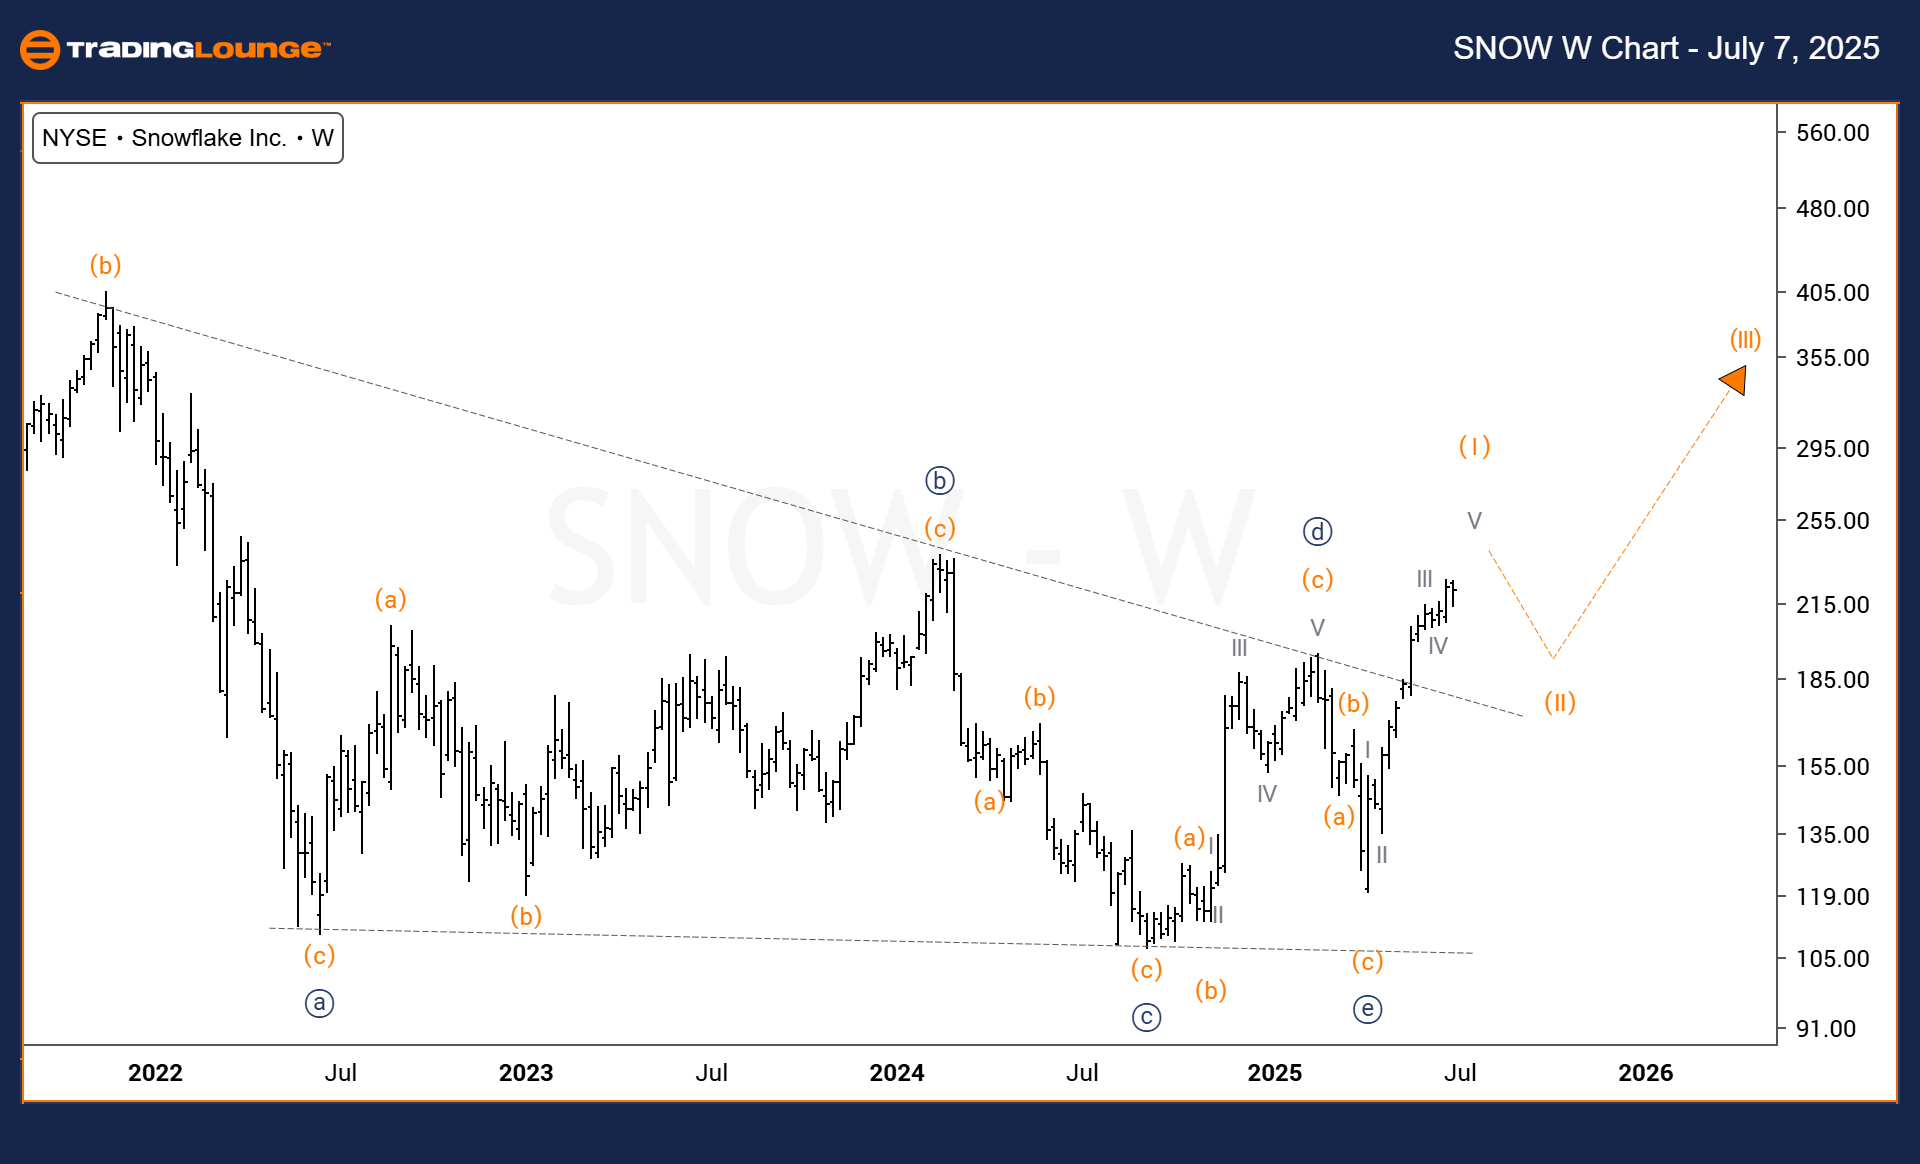
Snowflake Inc. (SNOW) – Elliott Wave Analysis | Weekly Chart

Technical Analysis Overview – Trading Lounge

Function: Trend

Mode: Impulsive

Structure: Impulsive

Position: Wave (III)

Direction: Uptrend toward Wave (III)

Details: Following a breakout from a triangle consolidation, Wave (I) has completed. Wave (III) is projected to begin once Wave (II) completes its corrective move.

Weekly Chart Summary:
On the weekly timeframe, Snowflake (SNOW) is advancing within a robust Elliott Wave impulsive sequence. The initial rally completed Wave (I) after breaking out from a consolidation triangle. The current pullback appears to be Wave (II), and once this corrective phase ends, Wave (III) is expected to trigger a strong upward movement. Wave (III) often represents the most dynamic part of an impulsive sequence, offering traders a high-probability entry point. Watch for minor consolidations and resistance zones as potential confirmation before the trend resumes higher.

Technical Analyst: Dhiren Pahuja

Visit: TradingLounge.com for detailed analysis and market updates.

Previous: Visa Inc. (V) Elliott Wave Technical Analysis

VALUE Offer - $1 for 2 Weeks then $29 a month!Click here

Access 7 Analysts Over 200 Markets Covered. Chat Room With Support

SNOW-us-stocks-W-Cha...

Related

Exxon Mobil Corp.(XOM:NYSE) Elliott Wave Technical Analysis

Exxon Mobil Corp.(XOM:NYSE) Elliott Wave Technical Analysis

Exxon Mobil Corp.(XOM:NYSE) Elliott Wave Technical Analysis  looking for longs after upside confirma...

Read More >
EURGBP Elliott Wave Analysis: Bearish Trend Continues with Orange Wave 3, Key Price Action, and Trading Strategy Insights

EURGBP Elliott Wave Analysis: Bearish Trend Continues with Orange Wave 3, Key Price Action, and Trading Strategy Insights

This EUR/GBP technical analysis applies the Elliott Wave Theory to evaluate the current bearish tren...

Read More >
Cochlear Limited Stock Forecast: ASX COH Elliott Wave Technical Analysis Predicts Bullish Trend and Share Price Targets Ahead

Cochlear Limited Stock Forecast: ASX COH Elliott Wave Technical Analysis Predicts Bullish Trend and Share Price Targets Ahead

Cochlear Limited (ASX:COH) shows a new bullish trend after completing an ABC correction, targeting h...

Read More >
NIFTY 50 Elliott Wave Technical Forecast: Stock Market Trends, Support & Resistance, Price Predictions, and Trading Signals

NIFTY 50 Elliott Wave Technical Forecast: Stock Market Trends, Support & Resistance, Price Predictions, and Trading Signals

NIFTY 50 Elliott Wave analysis, detailing key support and resistance levels, trend forecasts, and pr...

Read More >
Stocks Bullish Trend: NASDAQ, AAPL, AMZN, NVDA, TSLA, GOOGL, META, NFLX, MSFT, Elliott Wave Analysis

Stocks Bullish Trend: NASDAQ, AAPL, AMZN, NVDA, TSLA, GOOGL, META, NFLX, MSFT, Elliott Wave Analysis

NASDAQ Stock Market Elliott Wave Analysis and Trading Strategies Our Elliott Wave analysis covers t...

Read More >
U.S. Dollar/Canadian Dollar (USDCAD) Forex Elliott Wave Technical Analysis: Daily and 4-Hour Chart Insights

U.S. Dollar/Canadian Dollar (USDCAD) Forex Elliott Wave Technical Analysis: Daily and 4-Hour Chart Insights

Explore the in-depth USD/CAD Elliott Wave Analysis covering daily and 4-hour chart insights. Our ana...

Read More >

$1 for 2 Weeks

then $29 a month!

What a Special Offer!

Trade Recommendations

Unleash the power of deversified trading with our comprehensive portfolio, covering 250+ markets:

  • Stock Trades
  • Crypto Trades
  • Forex Trades
  • Commodity Trades
Elliott Wave Analysis

Gain a competitive edge with expert insights and AI-powered Elliott Wave charting into:

  • Global Indices
  • US Stocks & ASX Stocks
  • Forex & Crypto
  • Commodities
Top-Notch Trading Tools

Equip yourself with the tools of success:

  • Real-time Chat rooms
  • Elliott Wave Algorithm
  • Portfolio tools
  • TradingLevels
  • Screener
  • Trading Game
7 Elliott Wave Analysts

Stay ahead of the market with daily charts and insightful videos
Your secret to strategic trading!

JOIN HERE


Welcome to TradingLounge (ASIC A.R.No. 321187), specialists in trades, trading education and technical analysis, covering stocks, indices, commodities, forex and cryptocurrencies.

When you join TradingLounge you have access to everything we offer, including trade tools, educational content and a social platform to chat with like-minded investors.

Read more

@Copyright 2024 by tradinglounge.com

Contact Us

Australian no: 02 4787 6020

International no: +61 (2) 47876020

Pay with:

Find us on